
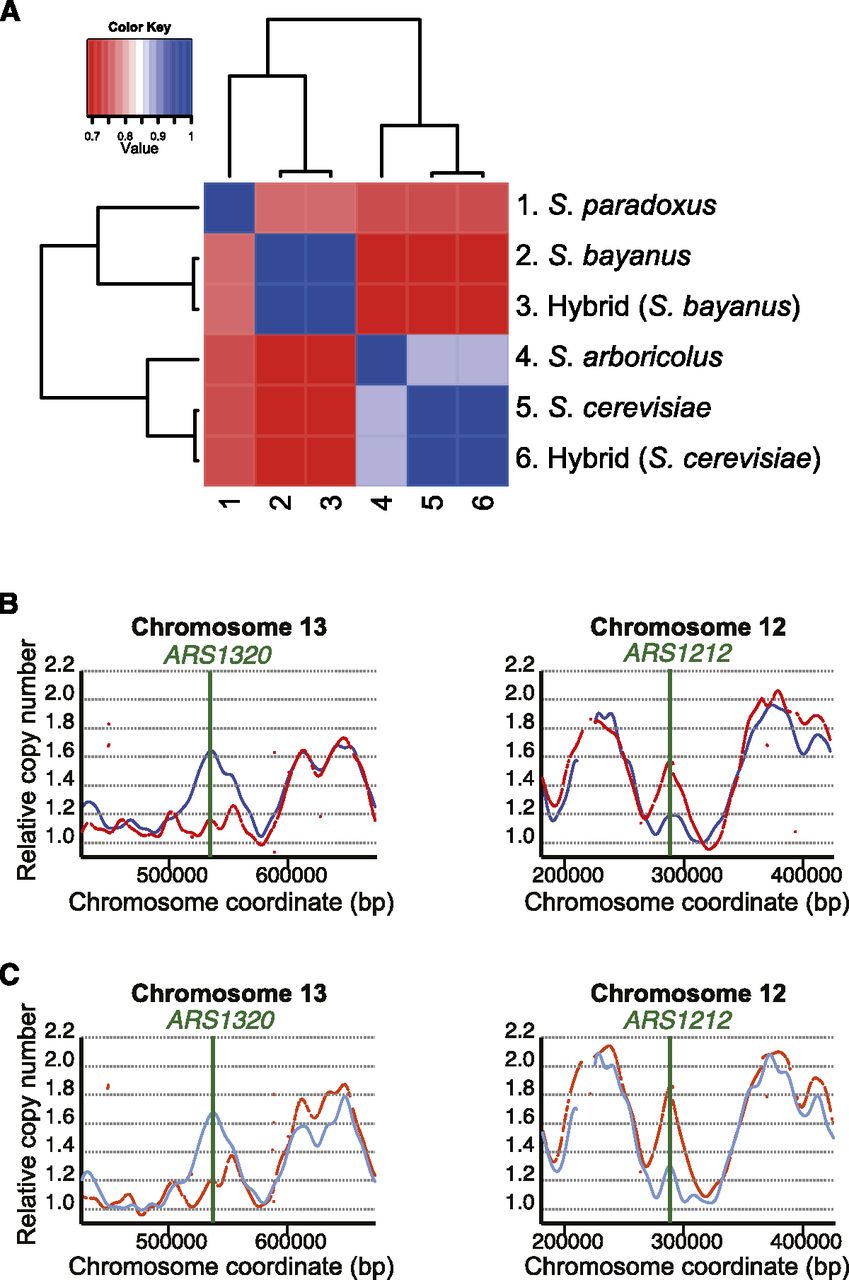
Figure 3.
Comparison of replication timing profiles identifies global similarities and local differences. (A) Clustered correlation matrix showing the genome-wide Pearson's correlation coefficients between the different data sets. Color shading represents correlation coefficients of 0.7 (red) to 1 (blue), with blue indicating the most highly correlated data sets. (B) Replication profiles identify differences in the activity of ARS1320 and ARS1212 between S. cerevisiae (blue) and S. bayanus (red). (C) Differences in origin activity remain in an S. cerevisiae (blue)/S. bayanus (red) hybrid. Sections of replication profiles are drawn as described in the legend to Figure 2.


