
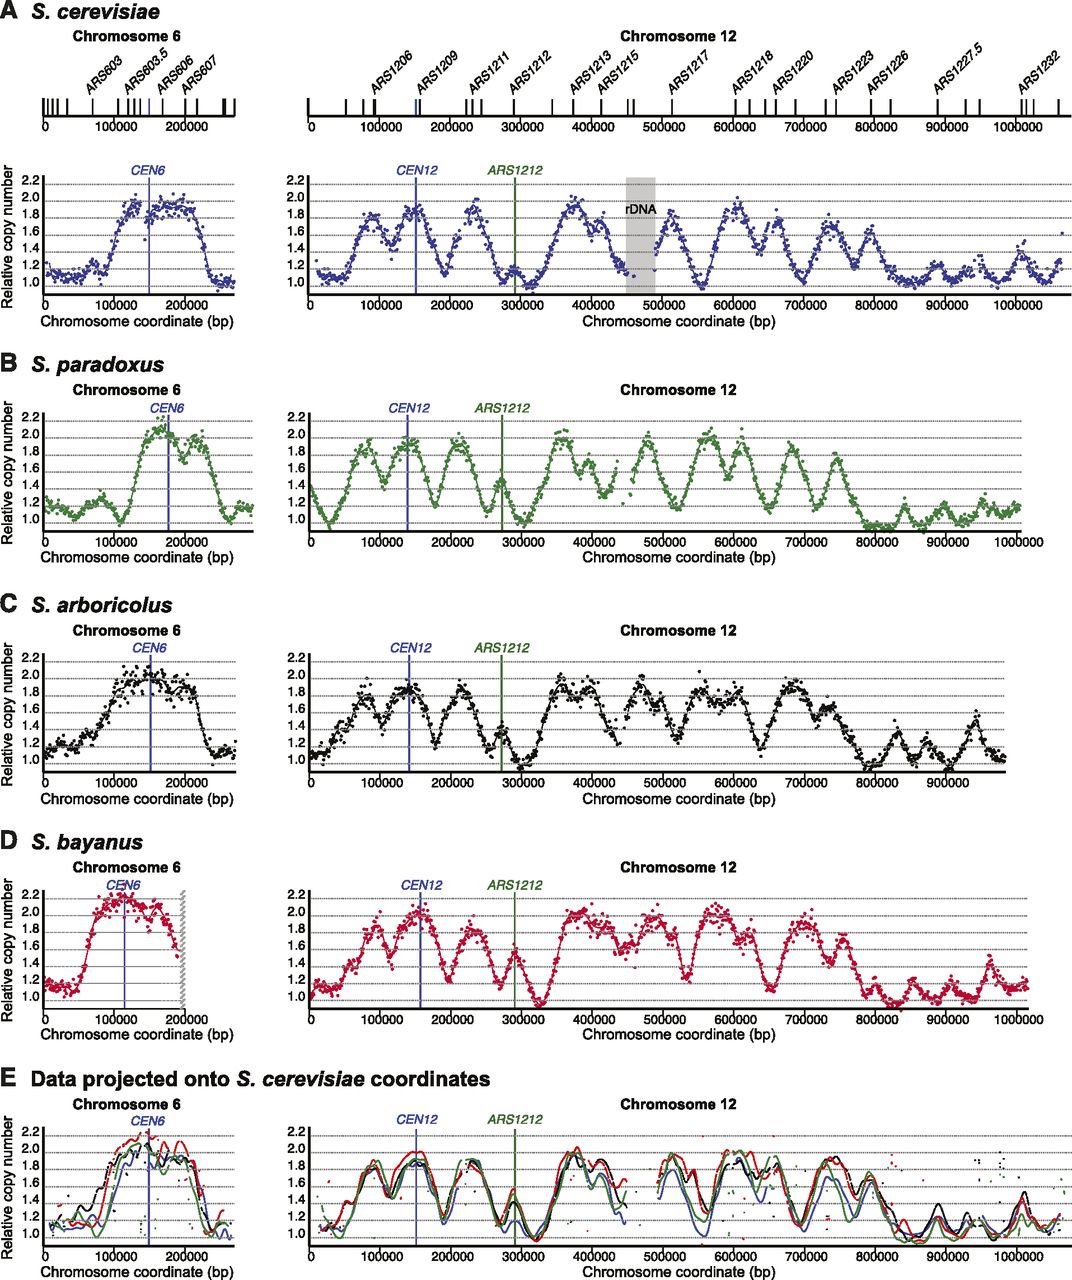
Replication “timing” profiles for chromosomes 6 and 12 from diploid sensu stricto species. Each profile shows the chromosomal position on the x-axis and the normalized relative copy number (as a proxy for replication time) on the y-axis. Individual points represent raw data with the line indicating smoothed data (see Methods). Profiles are shown for chromosomes 6 and 12 from S. cerevisiae (A), S. paradoxus (B), S. arboricolus (C), and S. bayanus (D). The locations of experimentally confirmed S. cerevisiae origins are shown above the profile (only a selection of active origins are named for clarity). (D) The position of the reciprocal translocation on S. bayanus chromosome 6 is marked by a vertical bar. (E) The smoothed data from all three species are shown projected onto the S. cerevisiae coordinates to aid comparison. Note that chromosome 12 includes the rDNA and associated nonunique loci to which we have not mapped reads (S. cerevisiae 450–490 kb).


