
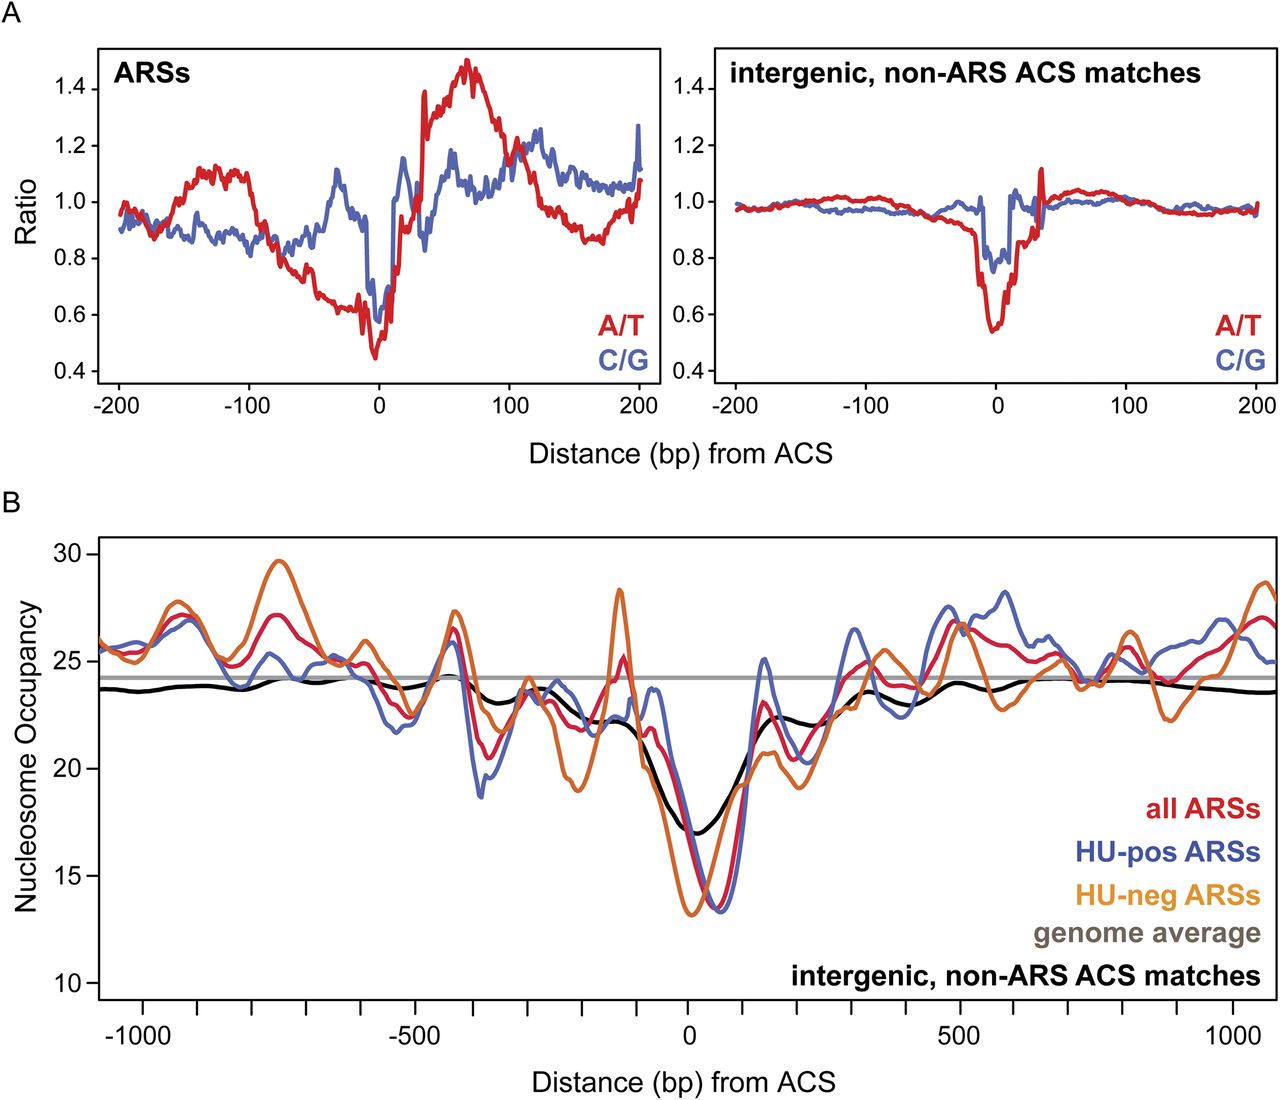
Figure 5.
A-T asymmetry and the nucleosome profile surrounding the L. waltii ACS. (A) The ratios of A/T and C/G bases around the L. waltii ACS are shown. All sequences were plotted such that the ACS begins at position 0 and are oriented such that the T-rich ACS strand is plotted. (Left plot) ACSs present in ARSs; (right plot) ACS matches found in intergenic, non-ARS locations. (B) The nucleosome profile surrounding the L. waltii ACS is shown. All nucleosome data are orientated as in A. The colored lines show the nucleosome profile: red, all ARSs; blue, HU-pos ARSs; orange, HU-neg ARSs; black, intergenic non-ARS ACS matches; gray, genome-wide average.


