
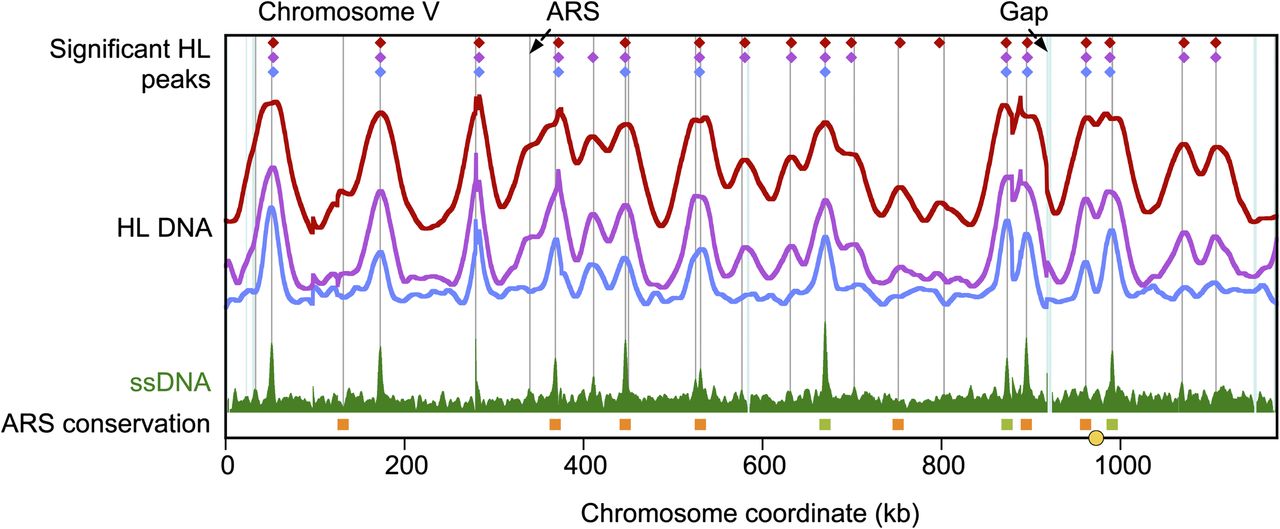
All L. waltii replication data for chromosome V. Profiles of % HL and HL DNA peak locations (color-coded as in Fig. 2) are shown above the ssDNA profile. (Gray vertical lines) ARS locations. (Blue vertical lines) Sites that are redundant in the genome and cannot be mapped by Illumina sequencing data. (Filled squares) L. waltii ARSs that show syntenic conservation with ARSs in one or more other species (S. cerevisiae, L. kluyveri, and K. lactis). Orange, green, or brown squares indicate conservation with one, two, or all three of these species, respectively. (No instances of conservation with all three species were seen on this chromosome.) The yellow circle at the bottom represents the centromere. Plots for all chromosomes are shown in Supplemental Figure S4.


