
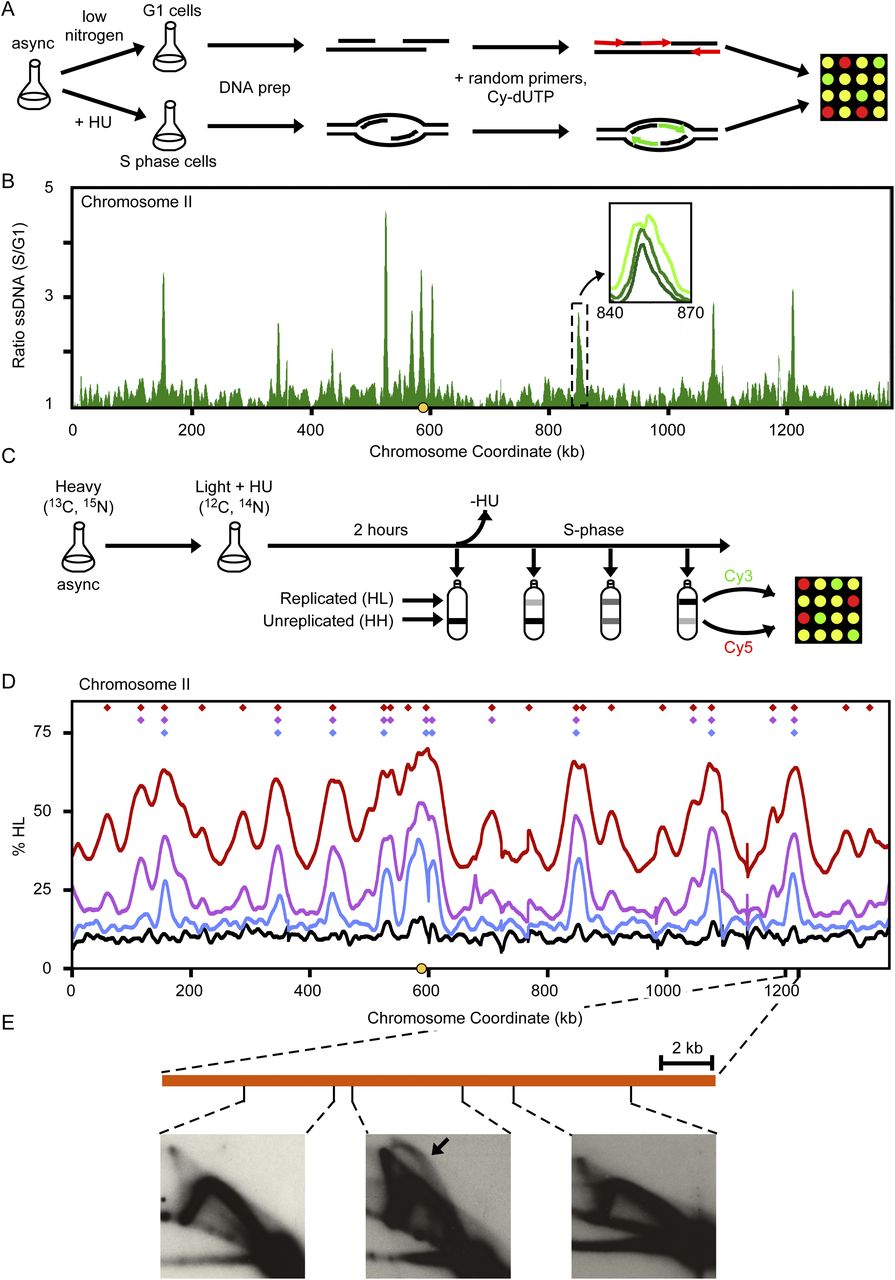
The ssDNA and density transfer assays. (A) Outline of ssDNA-based mapping of early-firing origins. L. waltii cells were treated with HU (200 mM) to enrich for ssDNA around origins of replication, or with low nitrogen medium to maintain cells in G1. ssDNA regions were labeled by random primed labeling without template denaturation and hybridized to a microarray. (B) The ratio of ssDNA in S/G1 is plotted for chromosome II. Early-firing origins are revealed as peaks in the plot. (Inset) Broadening in ssDNA peaks as S phase progresses. Plots for all chromosomes are shown in Supplemental Figure S2. (C) Outline of density transfer experiment to monitor replication dynamics. L. waltii cells were pregrown in a heavy isotope medium and then transferred to a light isotope medium containing HU (100 mM). After 2 h, HU was removed and cells were collected over the course of the S phase. DNA isolated from these samples were fragmented and subjected to ultracentrifugation to separate the heavy-heavy (HH), unreplicated DNA from the heavy-light (HL), replicated DNA. The HH and HL DNAs for each sample were labeled and competitively hybridized on a microarray. (D) Replication of chromosome II as revealed by the density transfer. The different colored lines correspond to samples taken at different times in the S phase: black (arrest), blue (15% HL), purple (25% HL), red (45% HL). The centromere is shown by a yellow circle on the x-axis. Color-coded diamonds above the plots indicate locations and samples in which origin activity (peaks of HL DNA) was detected. Plots for all chromosomes are shown in Supplemental Figure S3. (E) 2D gel analysis across a representative HL DNA peak confirms that the peak contains an origin.


