
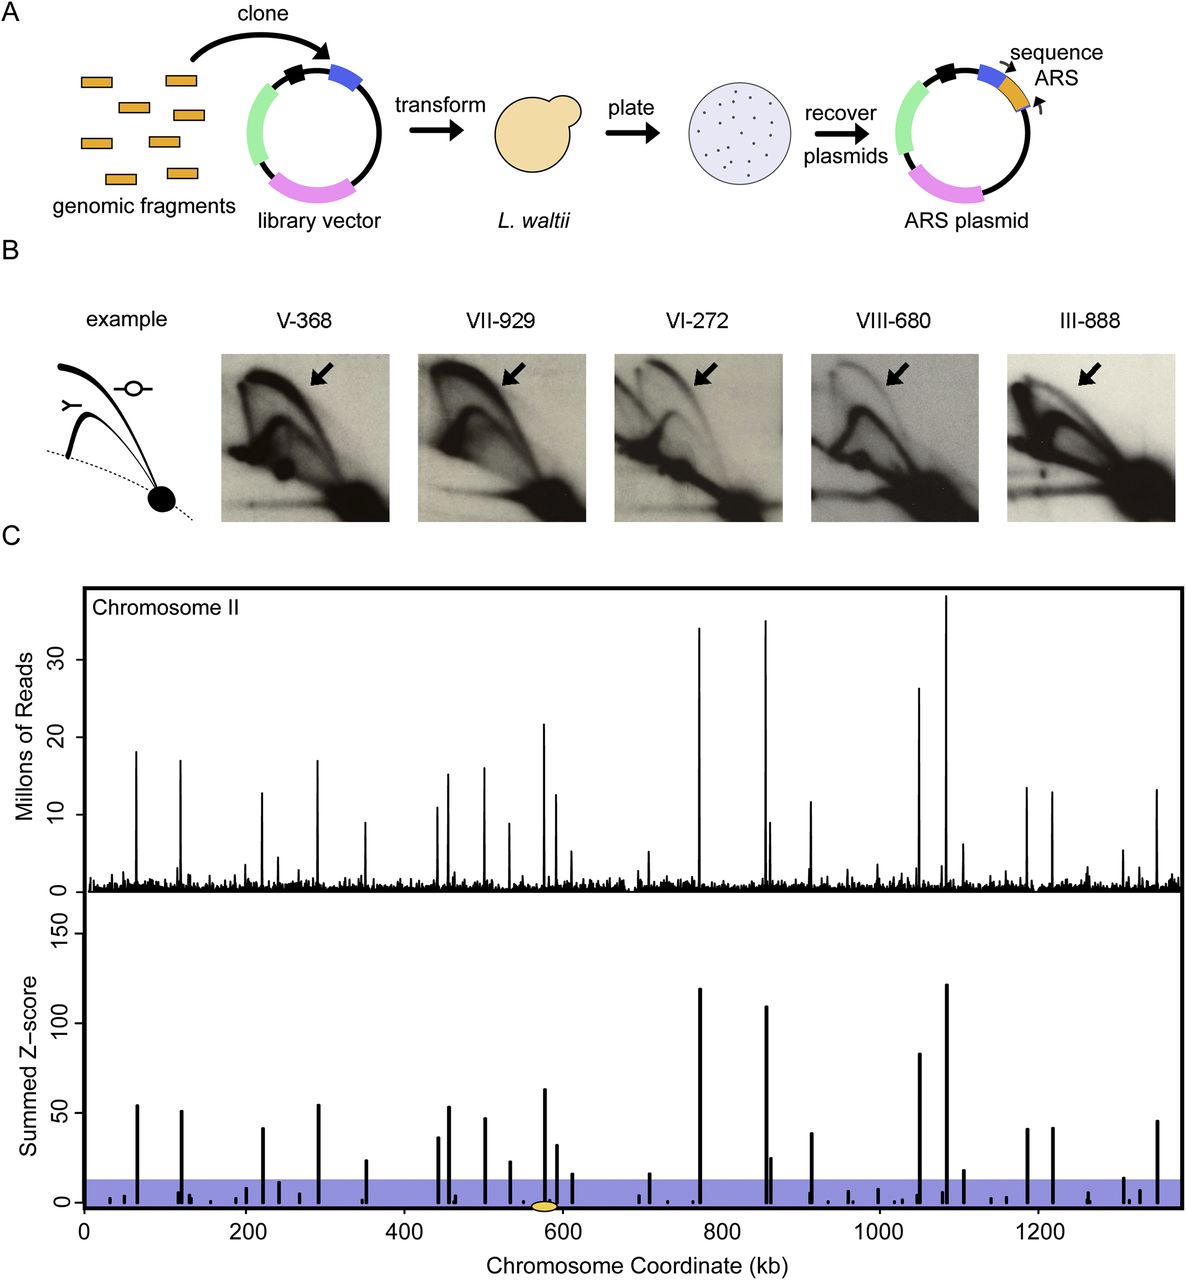
The ARS assay. (A) Sheared genomic DNA was cloned into a plasmid that contained a centromere but lacked a yeast origin of replication. The markers on the plasmid, indicated by boxes, in clockwise order and starting at the 1:00 position are LacZ (blue) multiple cloning site (contains SmaI, KpnI, and SacI sites), AmpR (pink), KanMXR (green), L. waltii CEN7 (black). Plasmids with genomic inserts were transformed into L. waltii and plated on G418. Colonies growing on G418 were presumed to have ARS elements in their inserts. These colonies were scraped and plasmids were extracted. Primers flanking the LacZ cloning site were used to identify the genomic insert (the ARS). (B) ARSs sequenced by Sanger sequencing were confirmed by genomic 2D gel analysis. The presence of a bubble arc (arrow) indicates that the sequence acts as a chromosomal origin. (C) All candidate ARSs were identified using Illumina sequencing. The top panel shows the raw sequencing data binned in 500-bp bins, shifting every 100 bp. The bottom panel shows the data after normalization against the genomic input library, removing all bins in the lower 97.5% of the data, summing adjacent remaining bins, and converting sequence read counts to Z-scores. Those remaining peaks with a summed Z-score of 12 or greater (above the shaded box) were scored as ARSs. The data for chromosome II are plotted with the centromere illustrated by a yellow ellipse. Plots for all chromosomes are shown in Supplemental Figure S1.


