
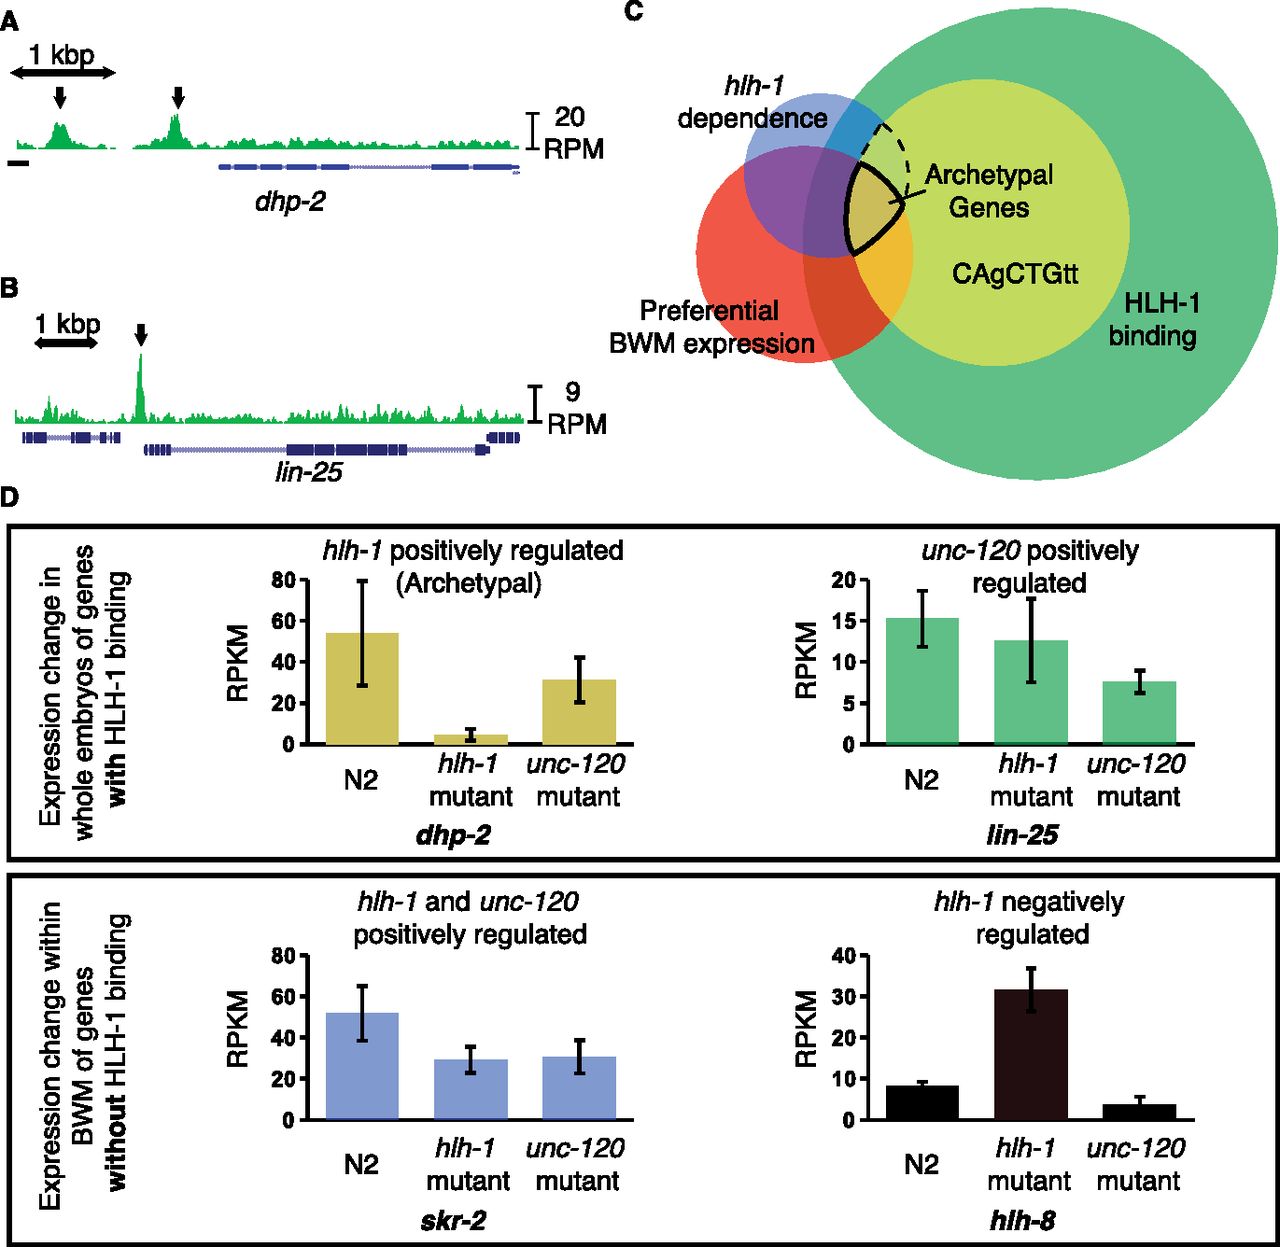
HLH-1 ChIP-seq binding is associated with, but not predictive of, regulation. HLH-1 binds to the genes (A) dhp-2 and (B) lin-25 (arrows). (C) Venn diagram shows four criteria for rating interactions of BWM preferred expression (red circle, 2175 genes), hlh-1 regulation of expression (blue circle, 757 genes), HLH-1 ChIP-seq binding (green circle, 9519 genes), and the presence of a local HLH-1 binding motif (yellow circle, 3469 genes). The intersect of 78 genes is highlighted as the “Archetypal Muscle List.” (D) Gene expression (RPKM levels from RNA-seq) levels illustrate different regulatory dependency patterns for hlh-1 and unc-120, with (upper) or without (lower) detectable nearby HLH-1 occupancy. dhp-2 (gold from panel C) represents archetypal muscle genes, positively regulated by hlh-1 with significant HLH-1 occupancy. lin-25 (green, from C) is positively regulated by unc-120 but not hlh-1, even though it has HLH-1 occupancy. skr-2 (blue, from C) is positively regulated by both hlh-1 and unc-120. hlh-8 (black) represents a class up-regulated only in hlh-1 mutant BWM, suggesting indirect negative regulation.


