
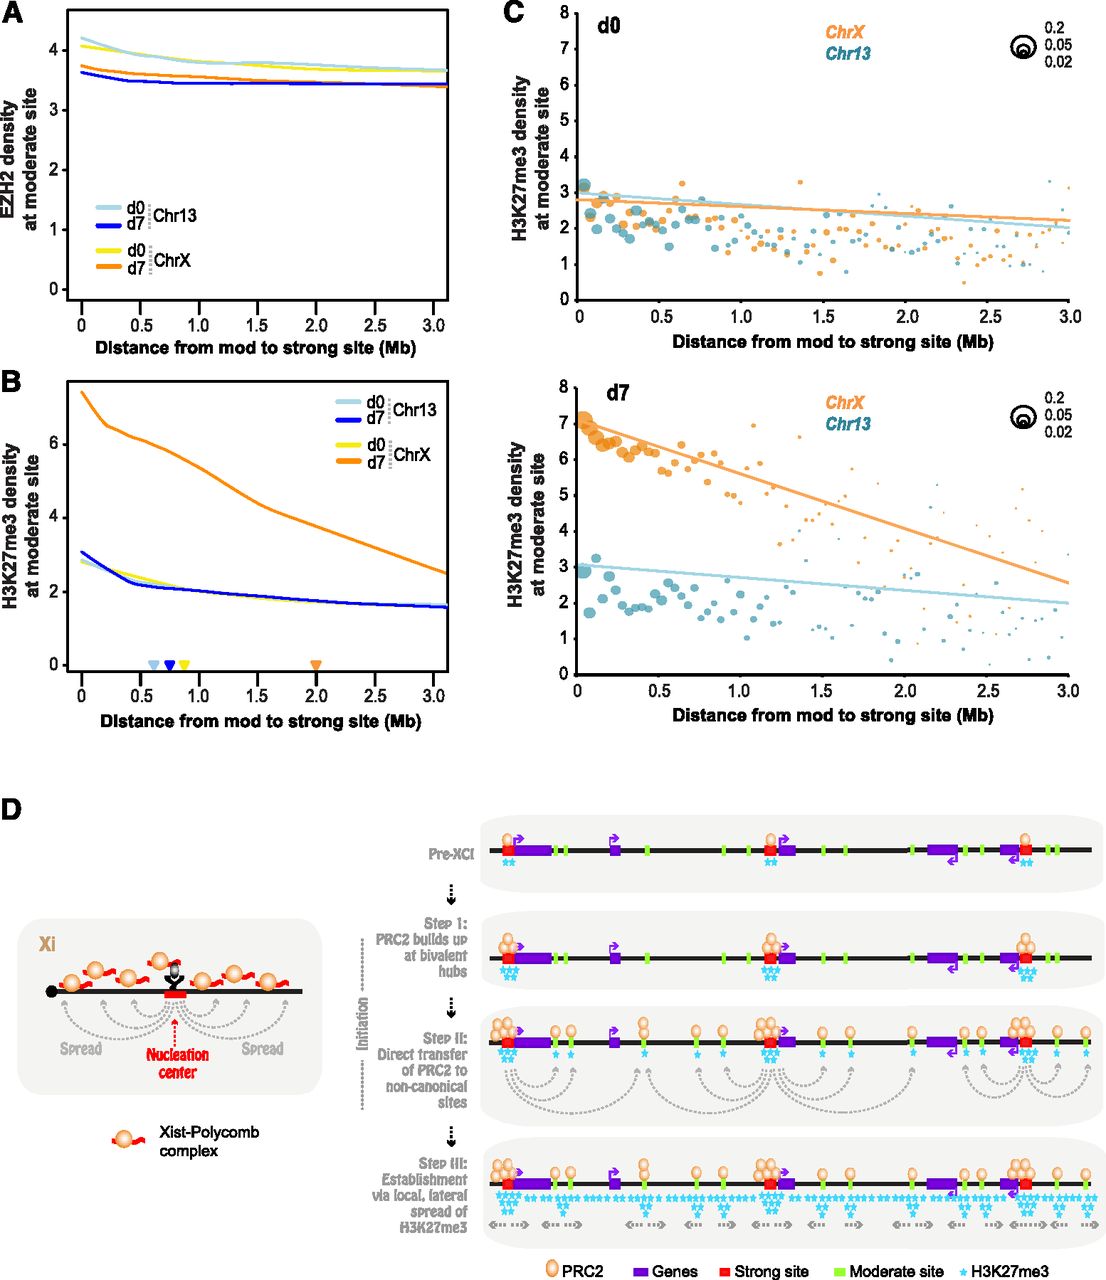
A hierarchy of EZH2 sites, with limited EZH2 translocation and long-range H3K27me3 gradient. (A) Smoothed trend lines of EZH2 densities at a moderate (mod) site at given distances (x-axis) from the nearest strong site, on indicated days and chromosomes. (B) Smoothed trend lines of H3K27me3 densities at a moderate (mod) site at given distances (x-axis) from the nearest strong site, on indicated days and chromosomes. Color-coded triangles denote distance-at-half-maximum for each chromosomal time point. (C) Depiction of the number of moderate (mod) sites at given distances from the nearest strong site on d0 and d7 for Chr13 and ChrX. Scale: Bubble sizes represent fractions of 0.2, 0.05, and 0.02 of all mod sites. Each graphed bubble represents the median of sites in 40-kb bins. Pearson correlation coefficients (R) and Z scores (Fisher transformed) are shown. (D) Model and summary.


