
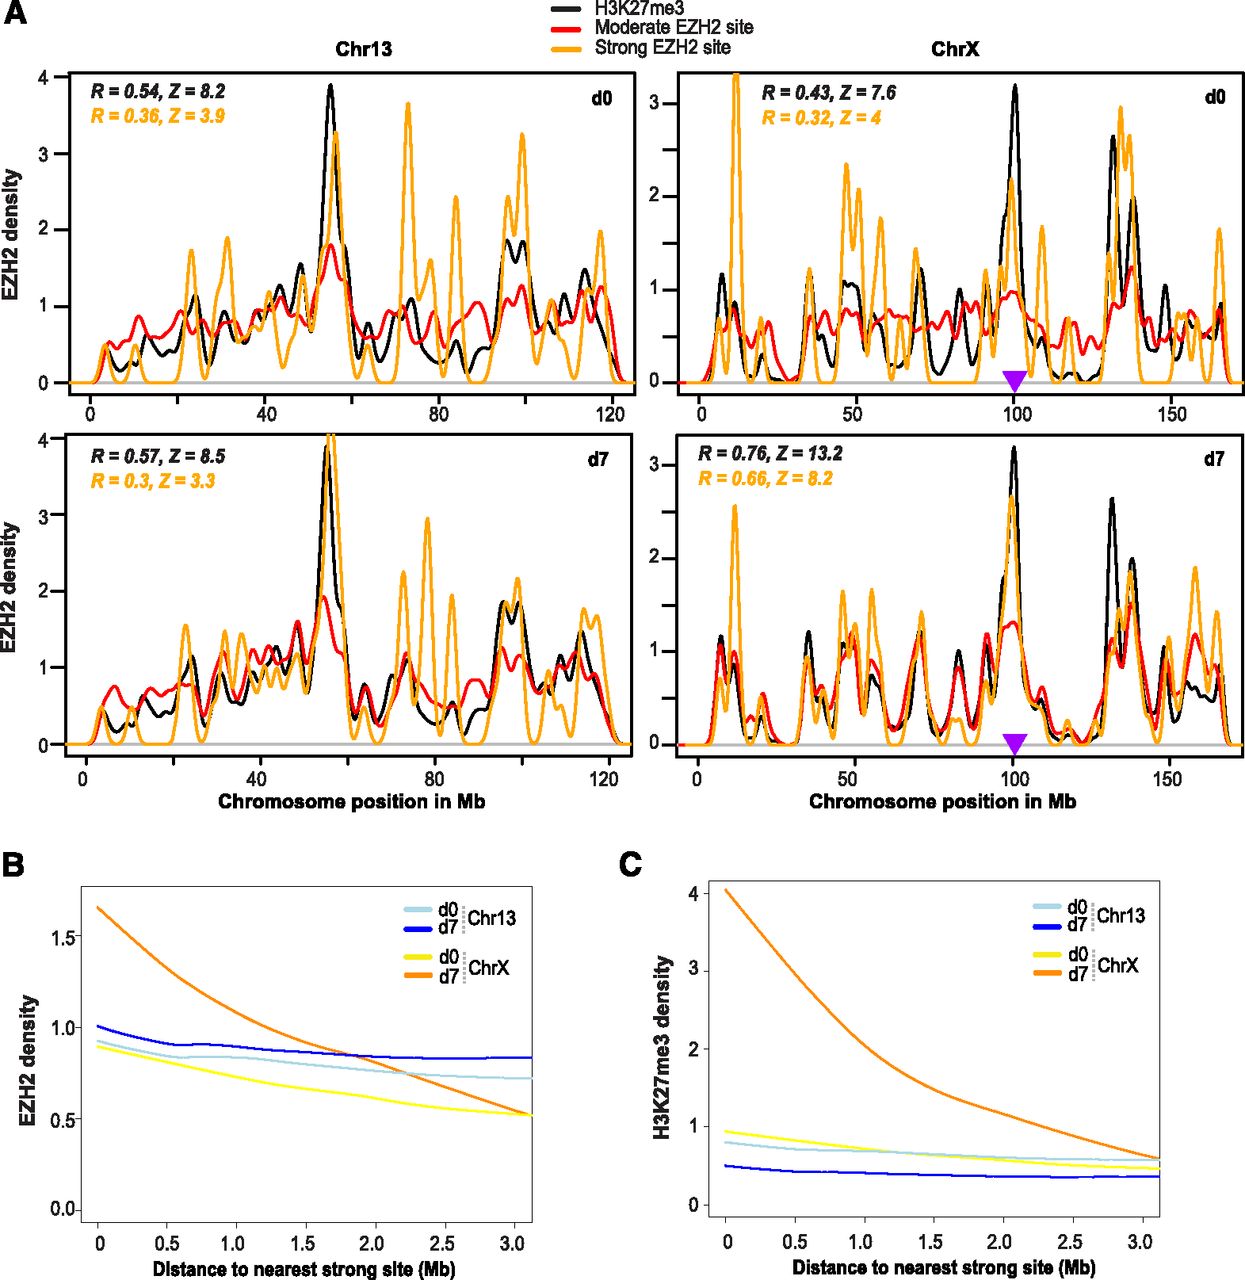
Spread of H3K27me3 from EZH2 sites occurs in a distance-dependent manner. (A) EZH2 and H3K27me3 densities from d0 and d7 were binned over Chr13 and ChrX positions to obtain correlation coefficients and Z scores from a permutation-based random model. Pearson R coefficients are indicated for the correlation of strong/moderate EZH2 sites (orange values) and H3K27me3/moderate EZH2 sites (black values). A purple triangle marks the location of the Xic. (B,C) Smoothed trend lines of EZH2 (B) or H3K27me3 (C) densities at a given distance from the nearest strong site, on indicated days and chromosomes. Densities are plotted over a sliding 1-kb window with steps of 200 bp.


