
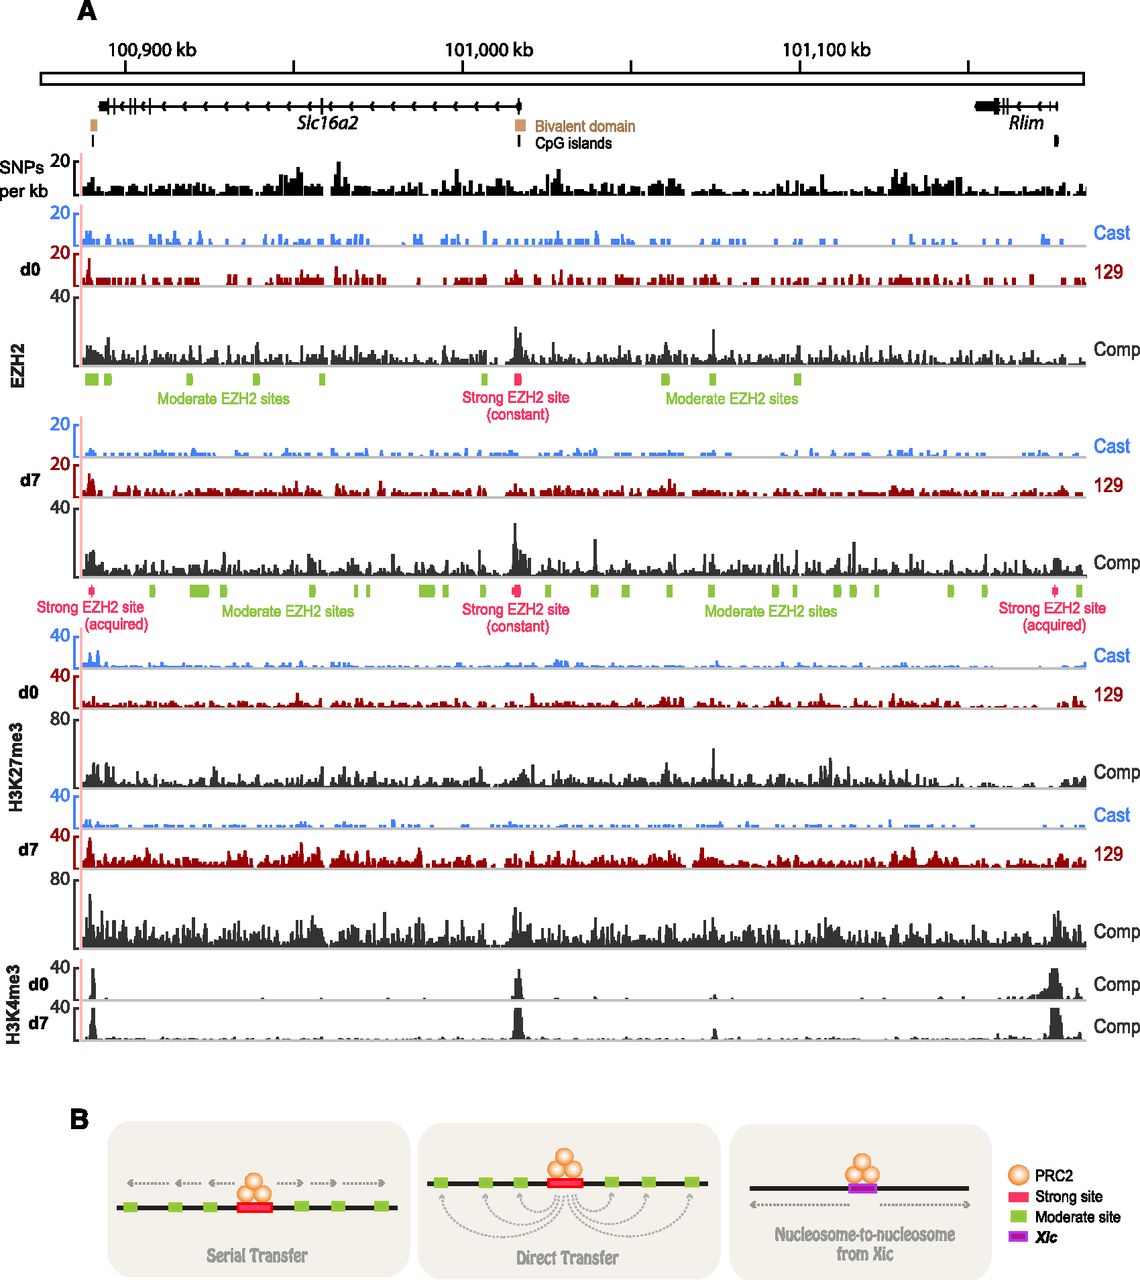
Figure 5.
Developmental profile of the Slc16a2-Rlim region. (A) Composite (comp) and allelic (Cast, 129) ES d0 and d7 profiles, showing strong and moderate EZH2 sites across the Slc16a2-Rlim region. SNP and Indel density per 1-kb window, CpG islands and bivalent domains are shown above the epitope tracks. (B) Three potential models for spreading of EZH2.


