
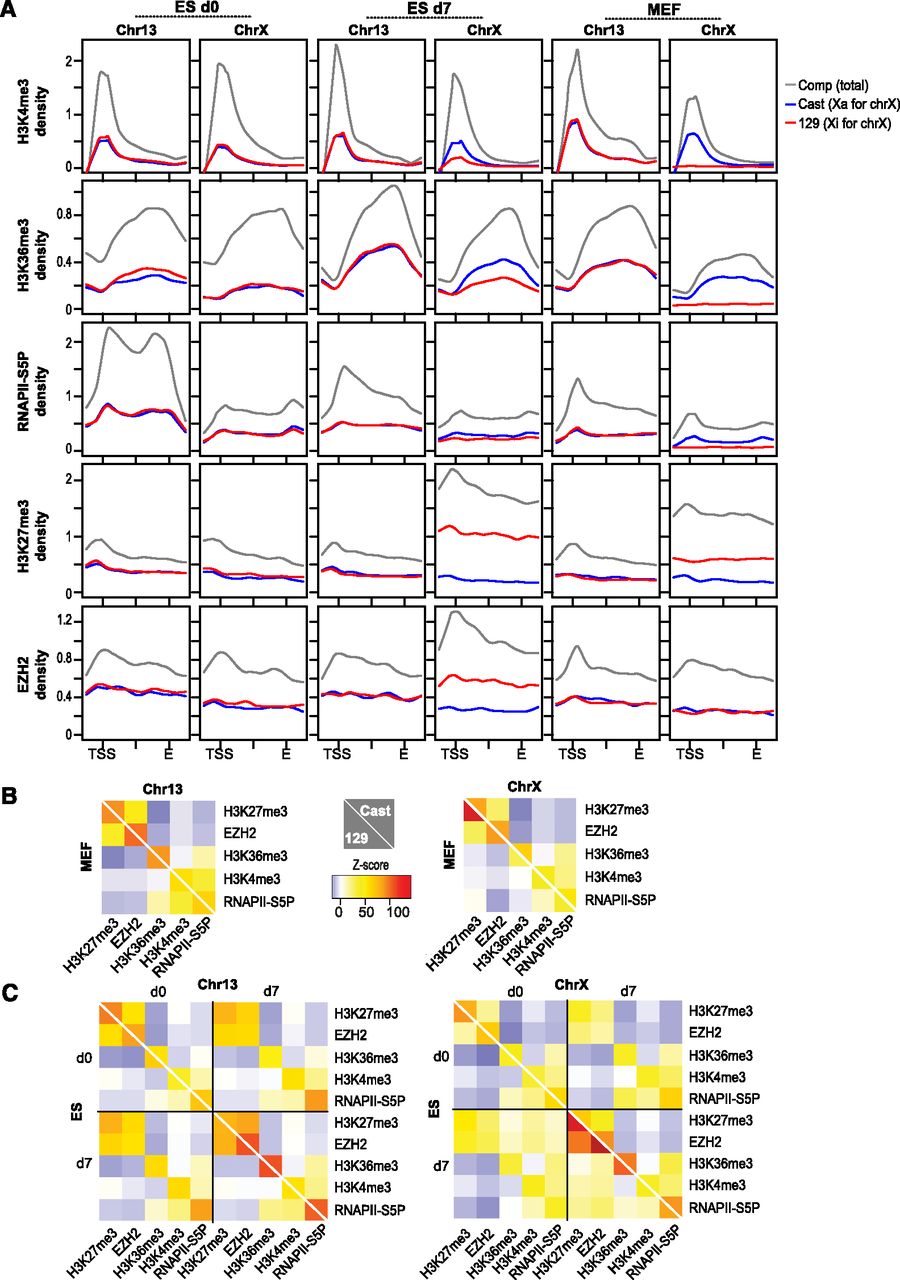
Allelic chromatin profiles of Xa and Xi. (A) Metagene analysis for chromatin epitopes on Chr13 and ChrX at indicated time points. Coverages were averaged over all genes (843 for Chr13, 1007 for ChrX) and scaled from the TSS to the 3′ end, E. Profiles extend 3 kb upstream of the TSS and 3 kb downstream from E. Densities were normalized to the average gene coverage over the chromosome. (B,C) Pearson correlations for pairwise comparisons between epitopes were compared to a permutation-based random model and resulting Z-scores plotted in heat maps. (B) Plots of MEF results. (C) Plots of ES d0 and d7 results. Numerical Z-scores are color-coded and scaled identically for all heat maps. (Yellow–red patches) Significant positive correlation, (blue patches) significant negative correlation. A white diagonal line separates Cast and 129 results.


