
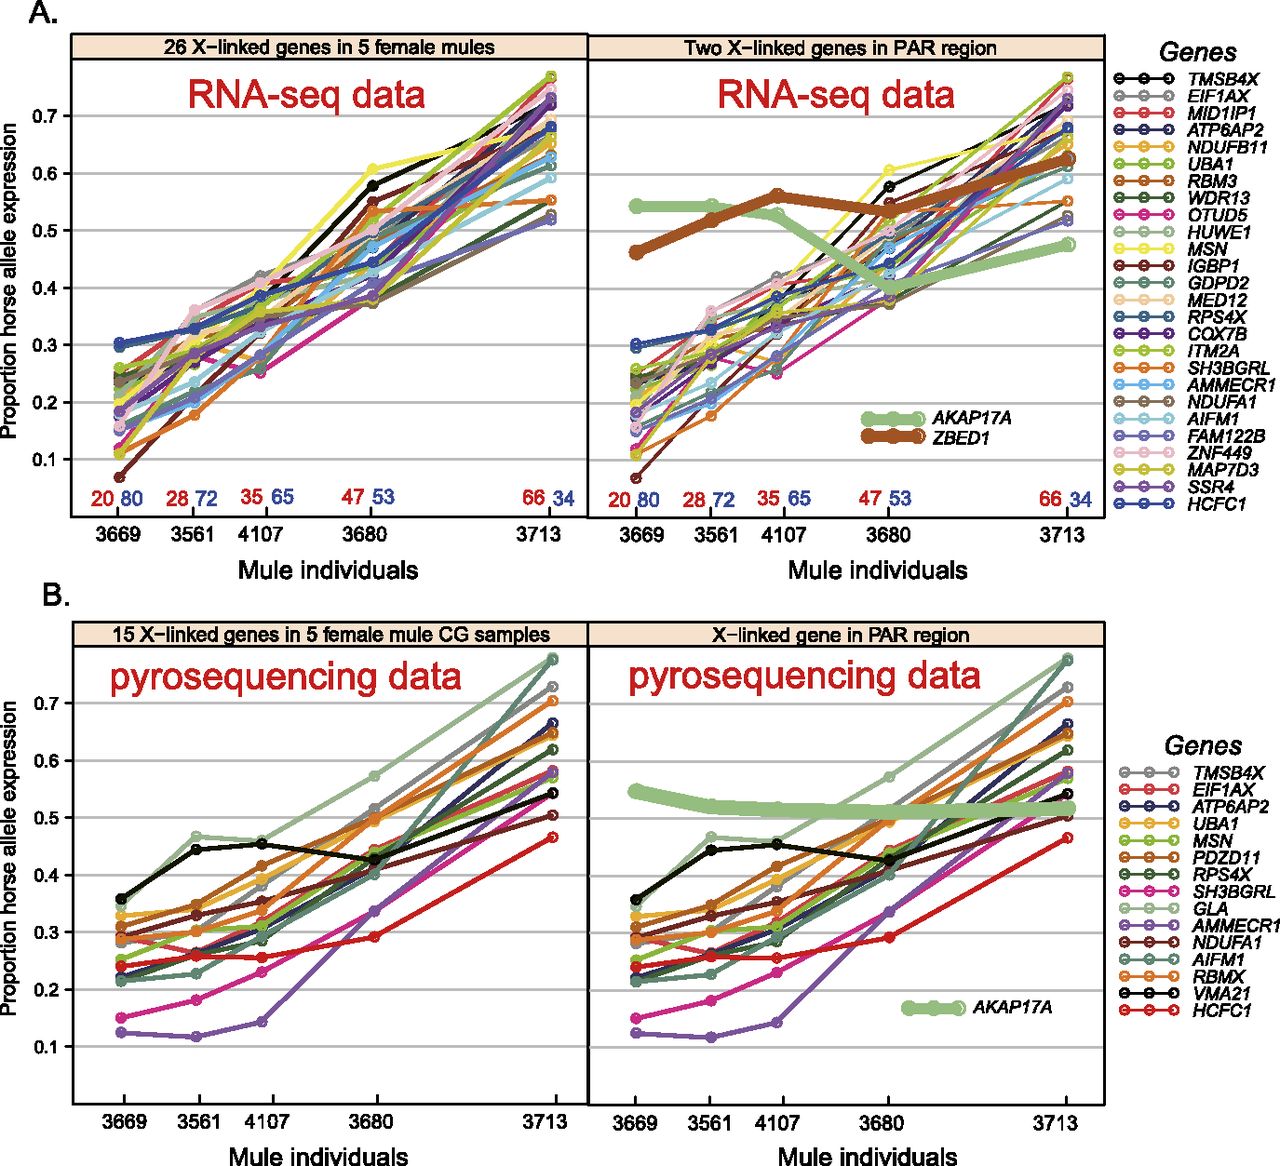
Plot of allelic expression proportions in five female mules for 28 X-linked genes in RNA-seq data and 16 X-linked genes in pyrosequencing verification data. (A, left) Allelic expression profiling of 26 X-linked genes in five female mules from the RNA-seq data. The x-axis simply arrays the five individuals. Plotted on the y-axis is the proportion of expression from the horse allele. Two genes (AKAP17A and ZBED1) in the pseudoautosomal region are highlighted in the right panel. (B, left) Allelic expression profiling of 15 selected X-linked genes in five female mules from pyrosequencing verification. The x-axis arrays the five individuals as in panel A. Plotted on the y-axis is the proportion of expression from the horse allele. The PAR gene AKAP17A is highlighted in the right panel.


