
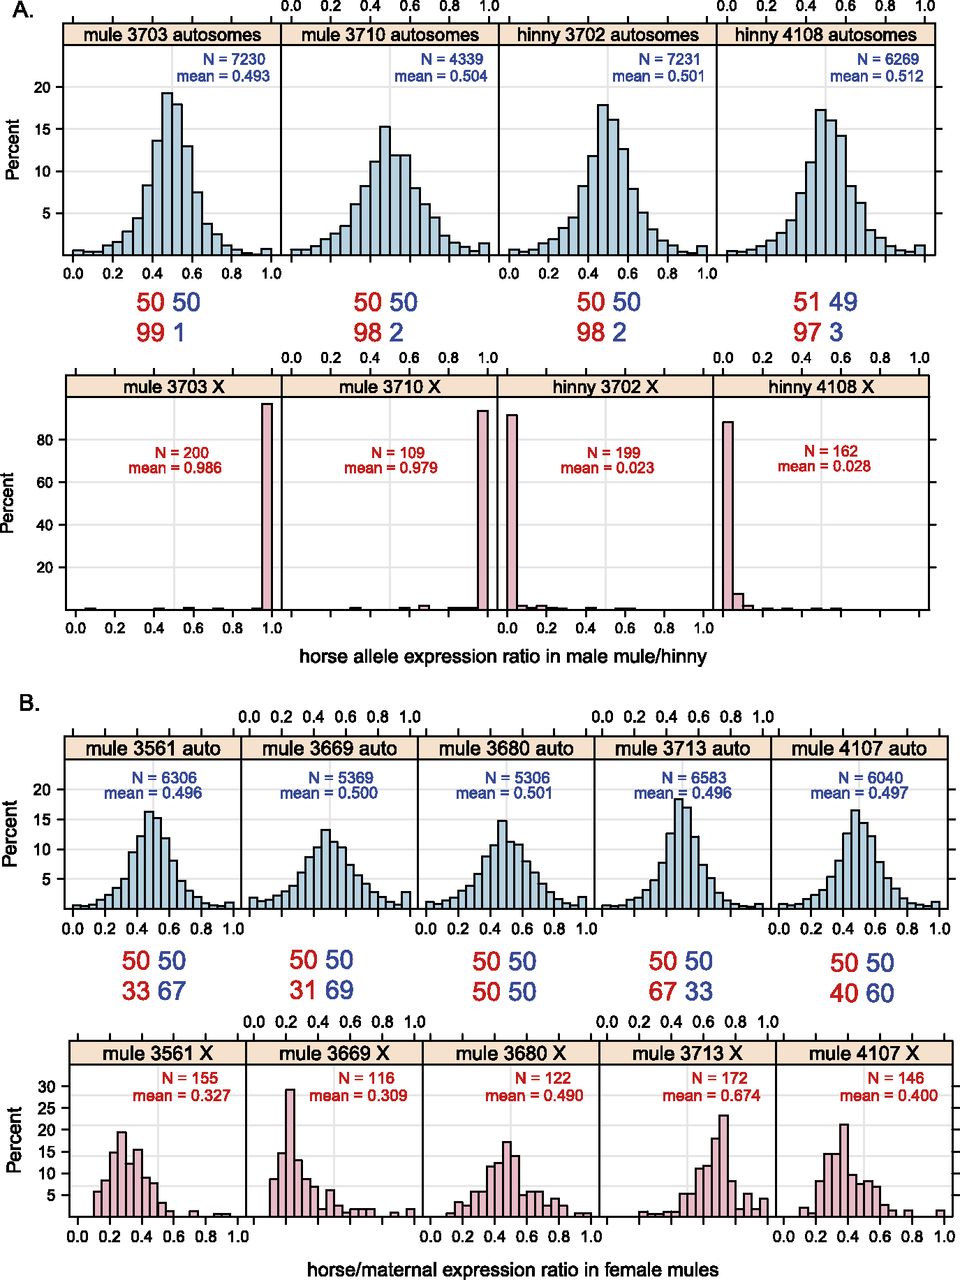
Transcriptome-wide distribution of allele-specific expression ratios in male and female mules and hinnies for autosomal and X-linked genes. (A) Histograms of the allelic expression ratios from the horse allele in chorionic girdle samples of two male mules (mule-3703 and mule-3710) and two male hinnies (hinny-3702 and hinny-4108). (B) Histograms of the allelic expression ratios from the horse (maternal) allele in chorionic girdle samples of five female mules (mule-3561, mule-3669, mule-3680, mule-3713, and mule-4107). In these plots, the y-axis shows the percentage of genes in each category of allele-specific expression ratio. The x-axis is the proportion of allelic expression from the horse in the mules and hinnies, ranging from 0 to 1. The average allelic expression proportion and number of informative genes with sufficient expression are labeled for each individual. (Top) Plots for autosomal genes in blue; (bottom) X-linked genes plotted in pink; (middle) comparison of mean maternal vs. paternal expression ratios between autosomal and X-linked genes for each sample.


