
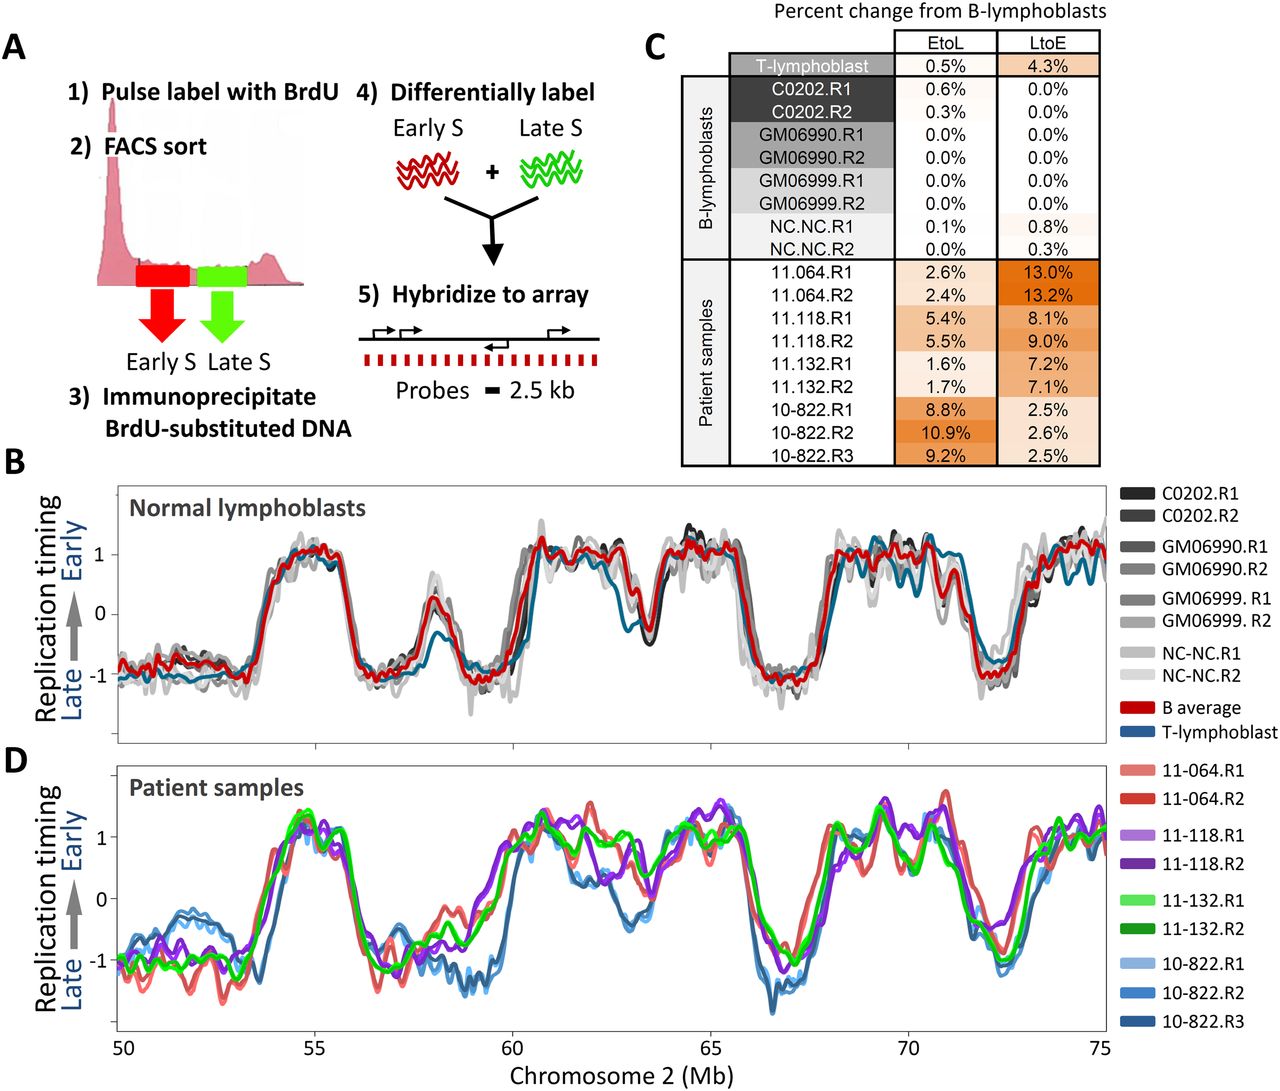
RT profiles are stable in nonleukemic lymphoblasts, but diverge in leukemic samples. (A) Method for generating genome-wide replication-timing profiles. Dividing cells are pulse labeled with BrdU and FACS sorted into early and late S-phase fractions, and nascent BrdU-substituted DNA is differentially labeled and hybridized on a tiling CGH microarray with even probe spacing. (B) Overlaid replication-timing profiles of a segment of human chromosome 2 for four nonleukemic EBV transformed human B-cell lines: C0202, GM06990, GM06999, and NC-NC. Each cell line is represented by loess-smoothed curves of two high-quality biological replicates (denoted R1 and R2; see Methods). The red profile is the average of the four B-cell lines, and in blue is a corresponding primary T-cell line. (C) Percentage of the genome with significant (>1 RT unit) timing changes toward earlier (L to E) or later (E to L) replication from the average normal B-cell profile, for each of the individual replicate profiles in B and C. (D) Profiles of four arbitrary patient samples, which diverge from each other and from lymphoblastoid B cells in a chromosome that did not harbor karyotypic rearrangements.


