
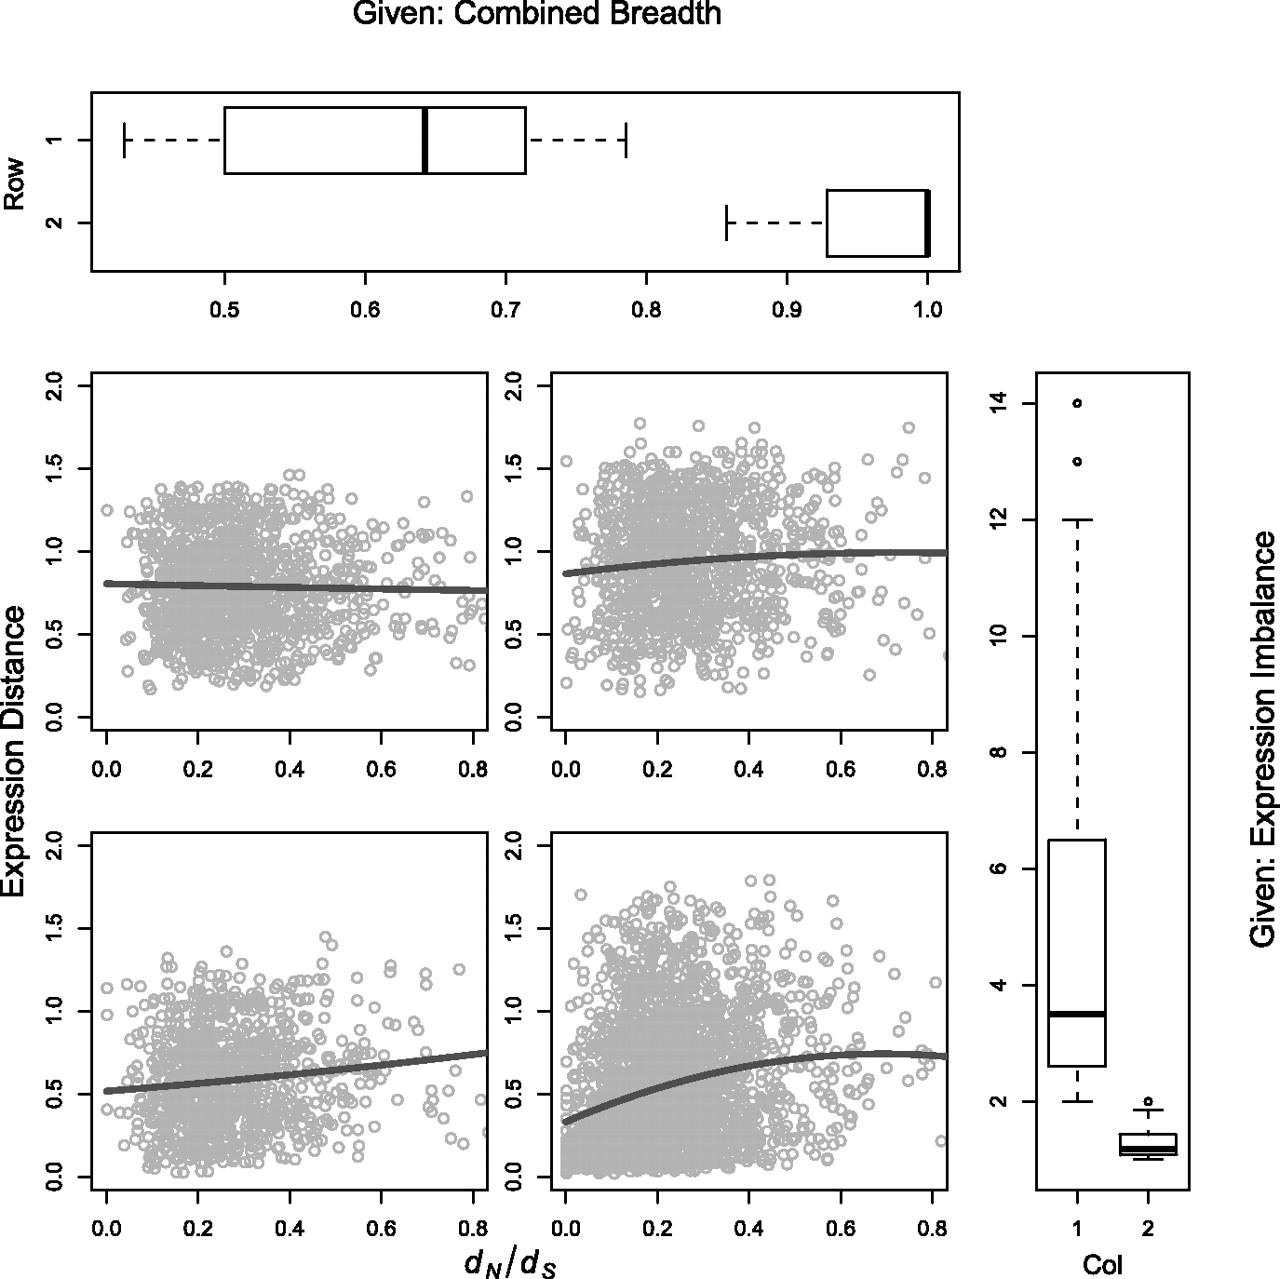
Figure 5.
Spearman expression distance plotted against dN/dS and conditioned on the combined breadth and the expression imbalance between the two genes within each duplicate pair. The line in each scatter plot represents the predicted expression distance, based on fitting to dN/dS + (dN/dS)2.


