
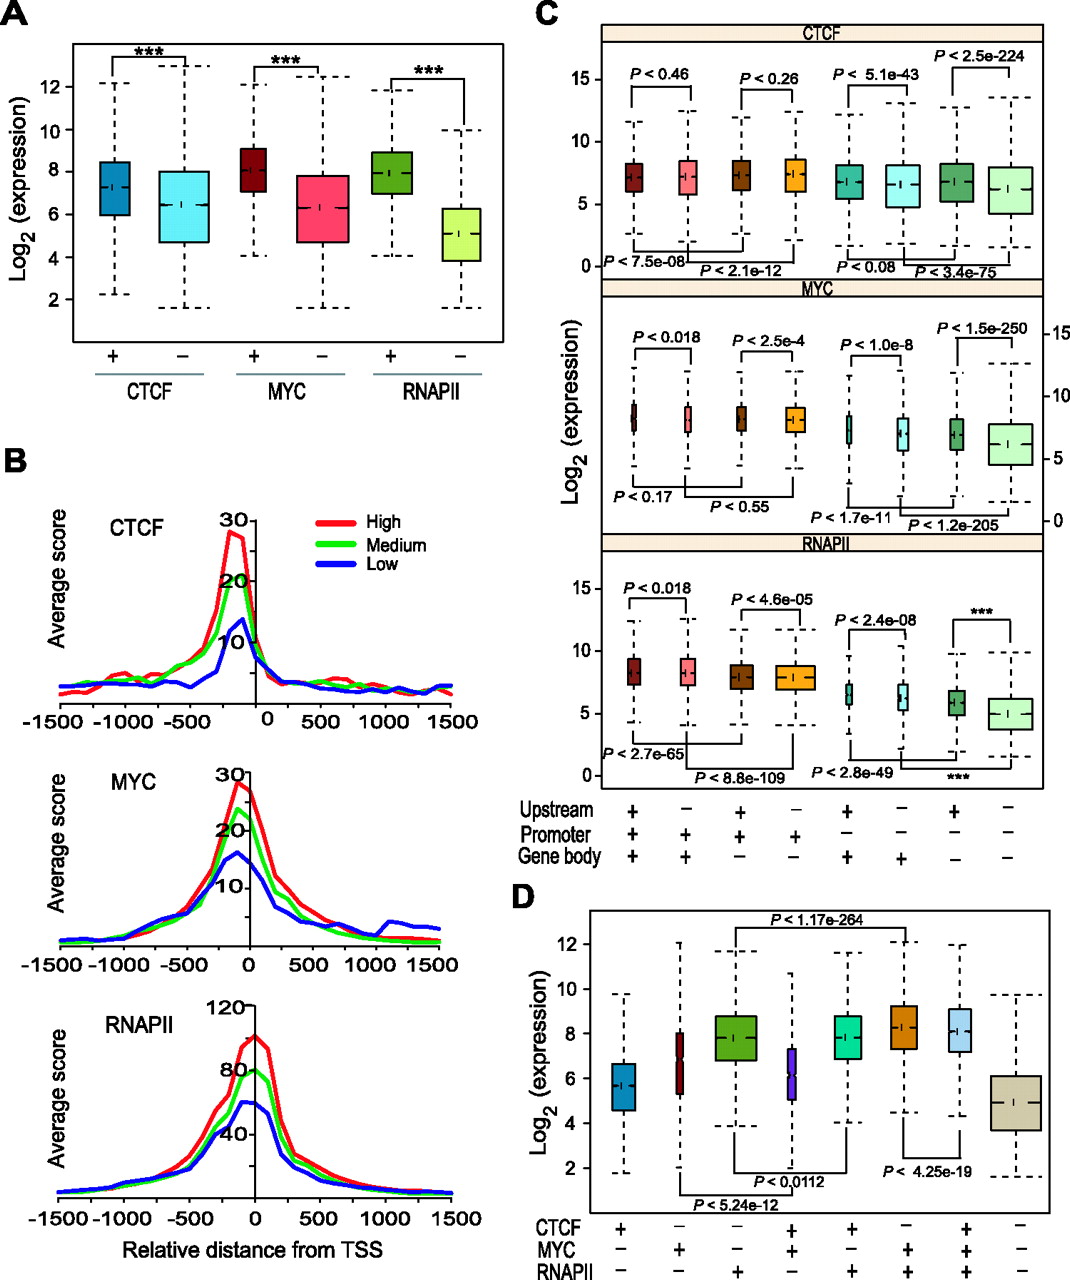
CTCF, MYC, or RNAPII binding is associated with activated expression of their target genes. (A) Boxplots show that genes downstream from promoters (within ±2 kb from TSS) bound by any one of the three factors have significantly higher expression than genes not occupied by them. Data shown are across all cell types. Groups along the x-axis indicate promoters either occupied (+) or not occupied (−) by the indicated TF. The y-axis shows transcript expression levels. P-values were calculated by Wilcoxon rank sum test. Three asterisks (***) indicate a P-value of zero. (B) TSS profiles of CTCF, MYC, and RNAPII binding in K562 cells over genes with different expression levels. Genes were divided into three different expression groups based on their expression level in K562 cells as top 33% (High), middle 33% (Medium), bottom 33% (Low). The y-axis indicates average ChIP-seq score. (C) Boxplots show distribution of gene expression levels of genes bound by TFs in three different genomic regions: promoters, upstream, and gene body. Occupancy of each factor in the indicated genomic location is shown as + (presence) and − (absence) at the bottom. The y-axis shows the log-transformed expression level of genes. Data shown are across all cell types. P-values were calculated by Wilcoxon rank sum test. (D) Boxplots show expression of genes with single and combinatorial binding of the three TFs across all cell types. Combinatorial binding of MYC and RNAPII enhances their target gene expression. The x-axis represents single-factor-bound or multi-factor-bound gene groups. Occupancy of each factor was shown as + (presence) and − (absence) at the bottom. The y-axis shows the log-transformed expression level of genes.


