
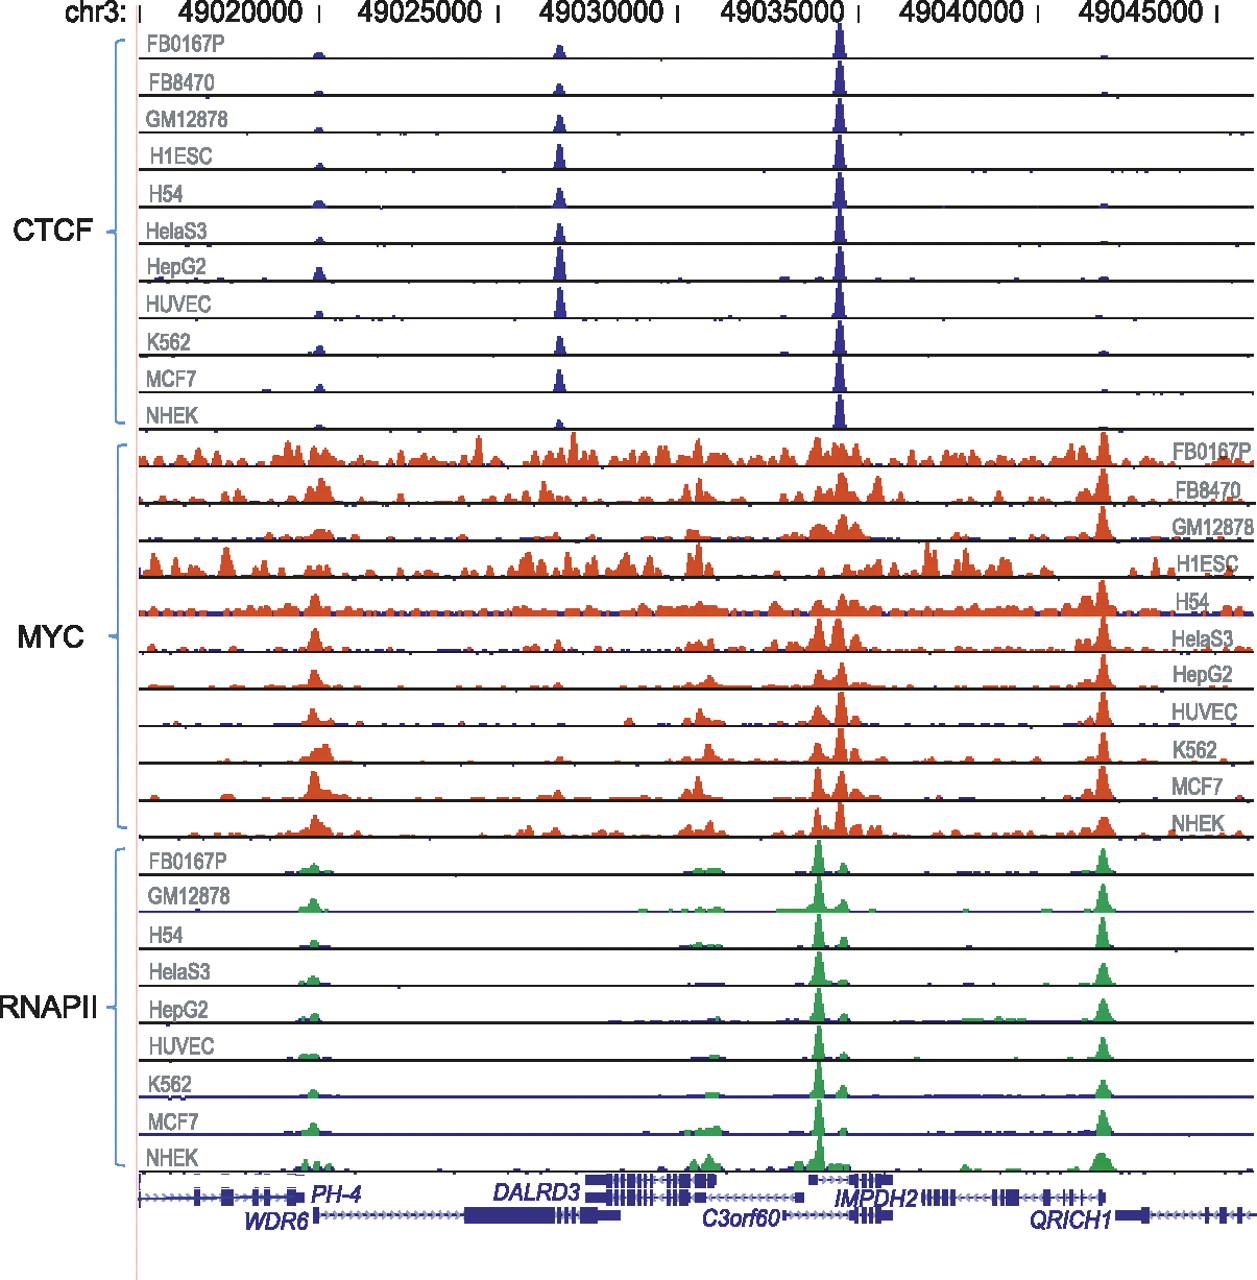
Figure 1.
Overview of ChIP-seq data over a sample genomic region. Chromosome coordinates are shown on top. Data for each cell line and factor are shown as a “wiggle” track of extended reads. Gene annotations derived from the UCSC Genome Browser database are shown at bottom, with the direction of transcription indicated by arrows.


