
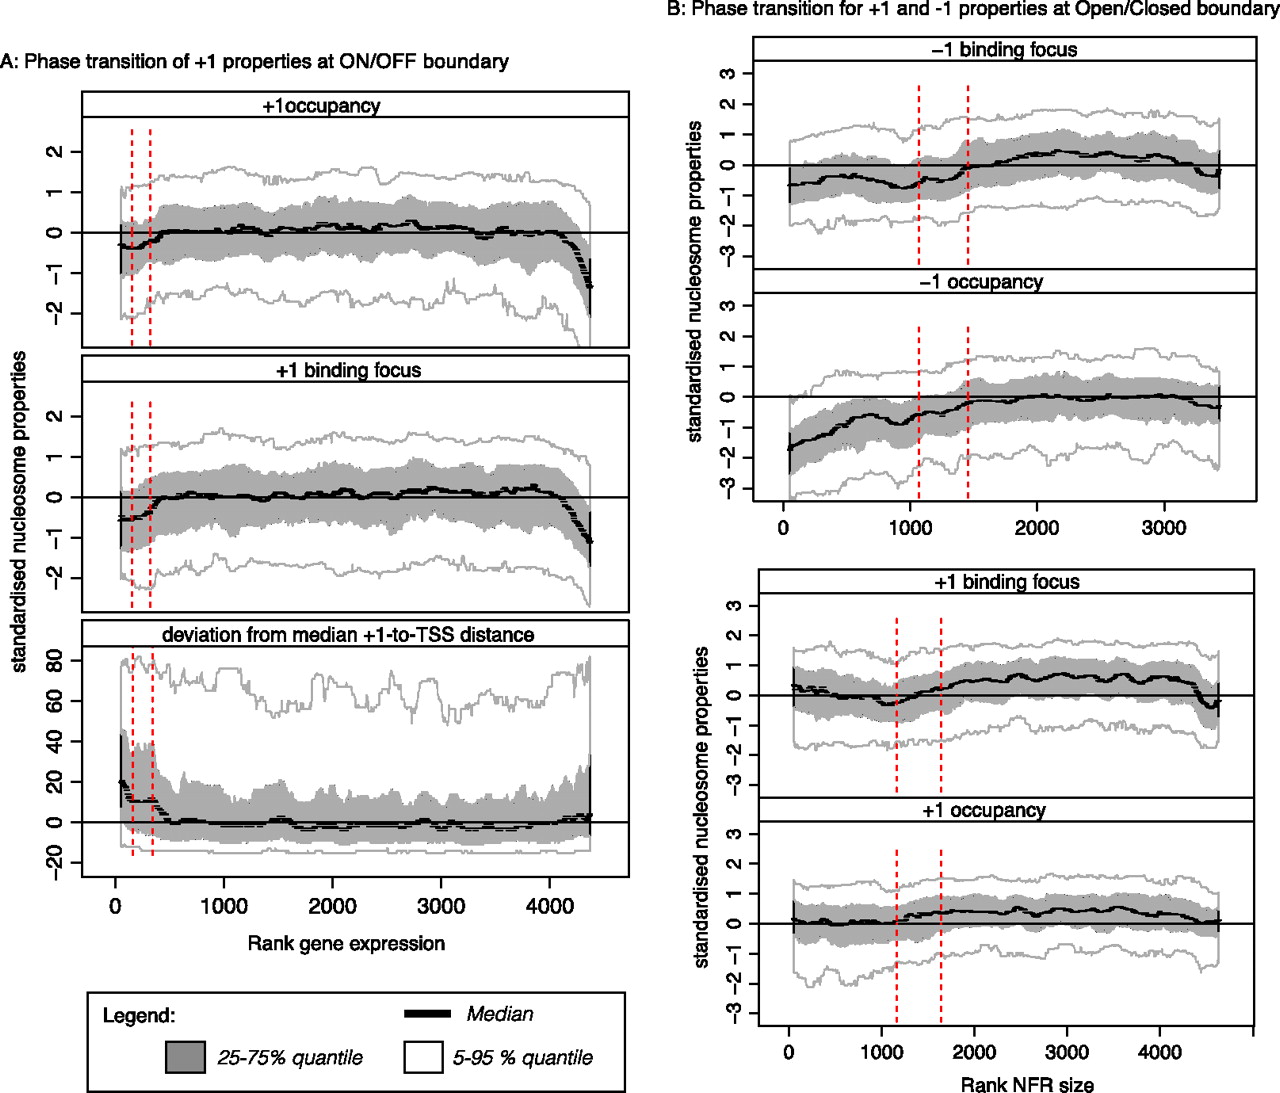
Phase transitions between promoter states. (A) Phase transition of +1 properties at ON/OFF boundary. The occupancy, binding focus, and the deviation from the median distance to the TSS (from top to bottom) for the +1 nucleosome are plotted against the rank of gene expression. The values were standardized and smoothed by a sliding window (window 200, step size 20). The median (black), 25%–75% quantiles (gray), and 5%–95% quantiles (white) are shown. A phase transition is observed at the boundary between ON an OFF genes. The red lines indicate the boundary for ON/OFF genes obtained from expression data with 1% and 5% FDR. The sudden fall in occupancy and focus toward the very highly expressed genes might suggest that nucleosomes get evicted upon very high expression. (B) Phase transition of +1 and −1 properties at Open/Closed boundary. The occupancy and focus for the +1 and −1 nucleosome are plotted against the rank of the NFR size. The values were standardized and smoothed by a sliding window, and the median (black dashed lines), 25%–75% quantiles (gray), and 5%–95% quantiles (white) are shown. A phase transition was observed for the −1 nucleosomes but not for the +1 nucleosomes. The red lines indicate the 60–90-bp window found in Figure 1A to mark the boundary between Open and Closed promoters.


