
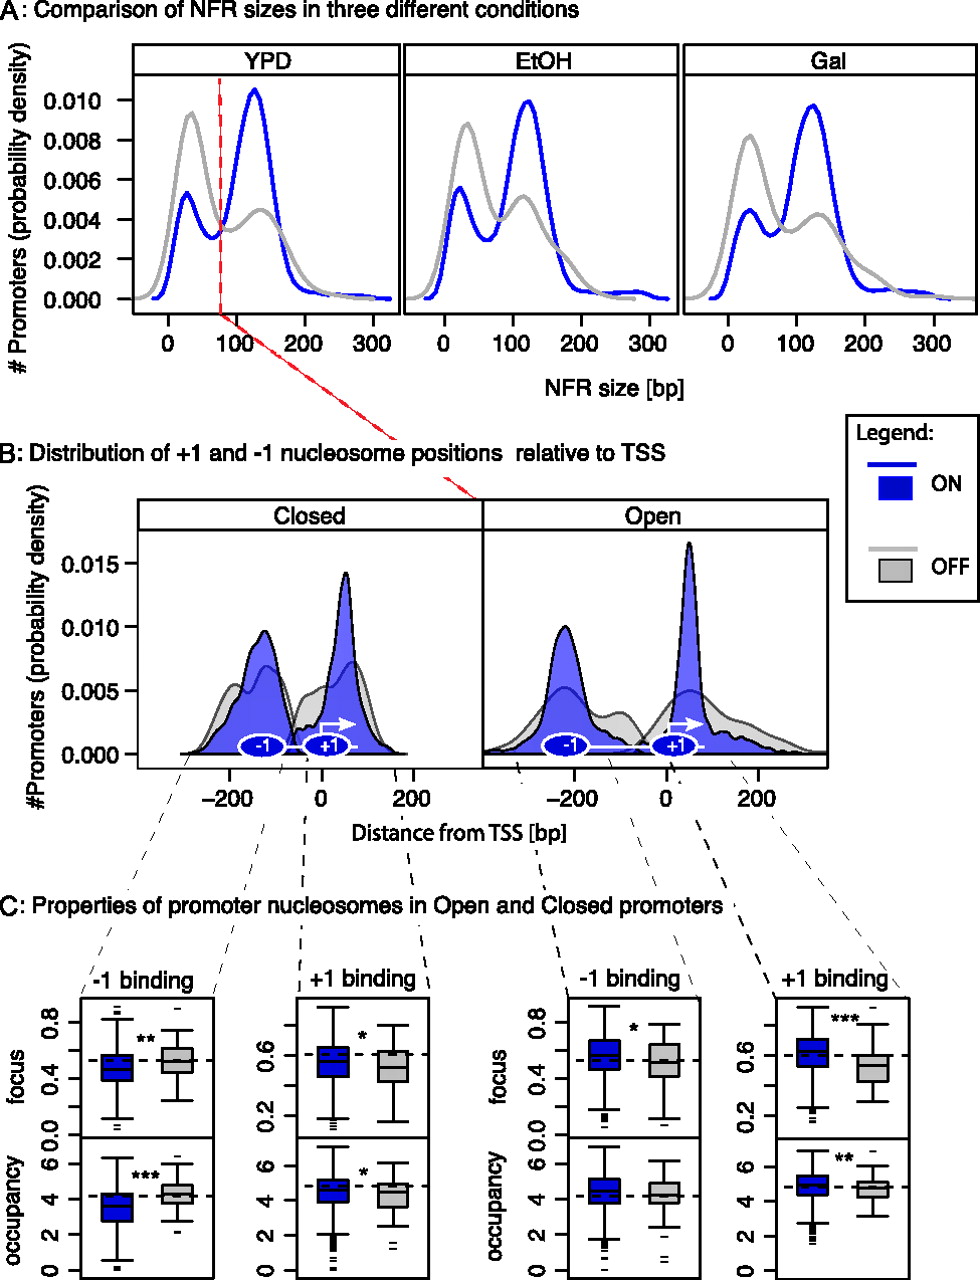
Classification of promoters based on distance between +1 and −1 nucleosome position. (A) Comparison of NFR sizes for ON and OFF genes in three different conditions. Distributions of NFR sizes for ON (blue lines) and OFF genes (gray lines) in YPD1, EtOH, and Gal (from left to right). Expressed genes tend to have larger NFRs than unexpressed ones; however, for both expression states, NFR sizes fall into bimodal distributions with minima ∼80 bp (red dotted line). NFRs were classified into Open and Closed states based on this threshold. (B) Position of +1 and −1 nucleosomes relative to the TSS in Open and Closed promoters. Distribution of distances (in bp) from the TSS to the midpoints of the −1 and +1 nucleosomes in promoters of ON (blue) and OFF genes (gray) in YPD. Promoters were separated into those with Open (left) or Closed NFRs (right). The +1 nucleosome is well-positioned in ON genes compared with OFF. In contrast, the −1 nucleosome is well-defined for genes with Open/ON NFRs, but relatively poorly for genes with Closed NFRs. (C) Properties of promoter nucleosomes in Open and Closed promoters. Distributions of occupancy (top) and focus (bottom) for −1 and +1 nucleosomes in promoters with Open and Closed NFR configurations. Genes were separated into ON (blue) OFF (gray). In all cases, the +1 nucleosome is more highly occupied and better focused in the ON state. The −1 nucleosomes in Closed promoters, however, shows the opposite pattern with less occupancy and focus in the ON than in the OFF state. Wilcoxon rank sum test, P-value <0.05 (*), <0.01 (**), and <0.001 (***).


