
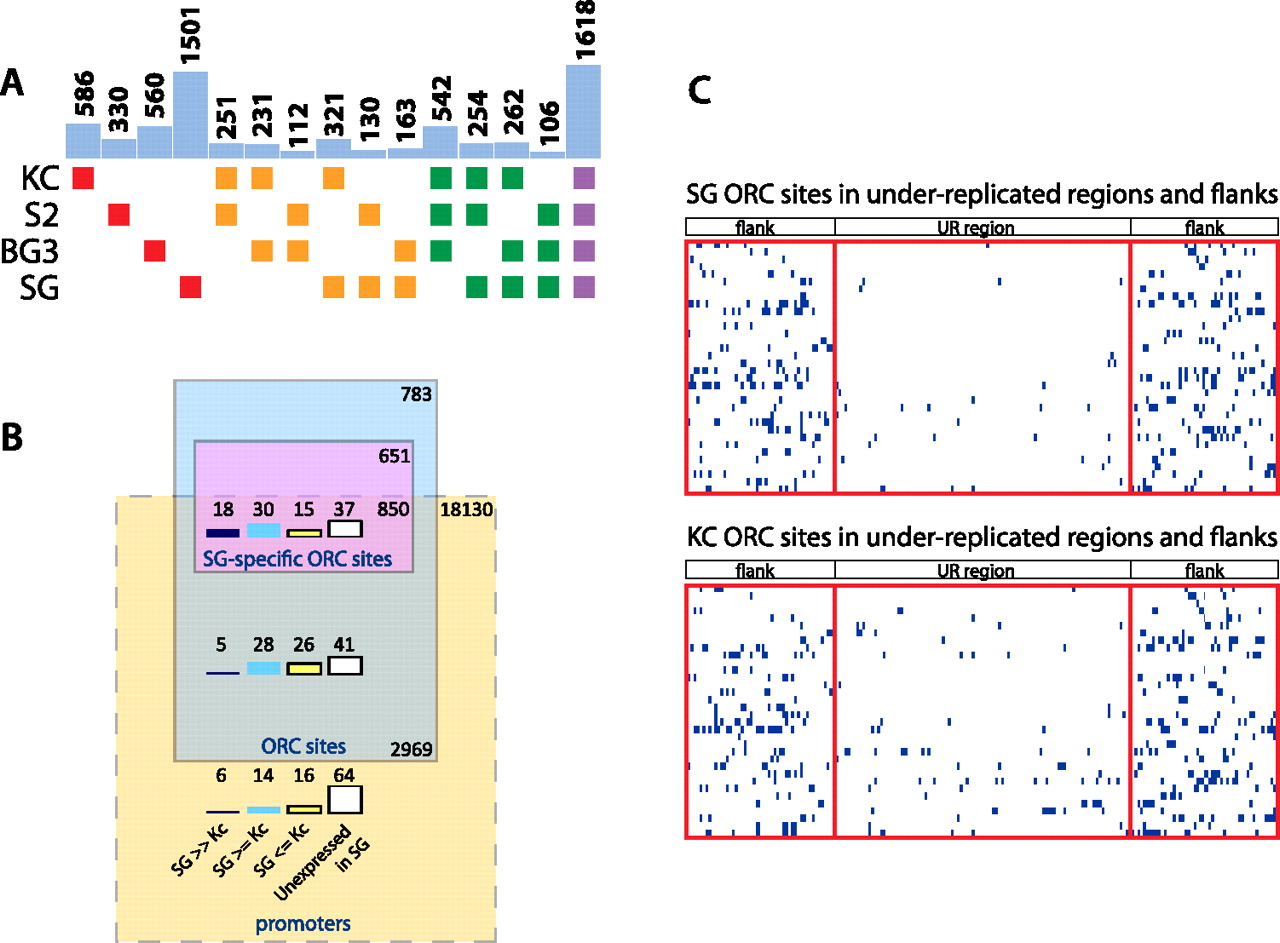
Comparison of ORC binding sites in salivary gland cells (SG) to those in Kc, S2, and Bg3 Drosophila cell lines. (A) Origin binding sites were compared between the different cell types (cultured cell lines or salivary gland) indicated on the left. (Red boxes) Origins unique to a single cell type; (orange) origins shared by two cell types; (green) origins shared by three cell types; (purple) origins shared by all four cell types studied. Bars in blue above the boxes show the number of origins shared by the cell types indicated by the color-coded boxes below each bar. Less than 1 kb proximity of ChIP peaks was required for binding site conservation. The number of ORC binding sites differs slightly from that reported by Eaton et al. (2011) because our data merge some ORC binding sites into broader peaks. (B) Rectangular Venn diagram comparing the relationship between ORC binding and TSSs in salivary glands and Kc cell culture, with rectangles drawn to scale. After identifying the TSS nearest to each ORC site, the percentile rank of the corresponding transcript (in RPKM) was determined from the salivary gland and Kc cell RNA-seq data. From the difference in percentile ranks (DPR) between the salivary gland and Kc cell, each transcript was classified as salivary gland specific (SG >> Kc, for DPR > 40, black), higher in salivary gland or no difference (for DPR between 1 and 40, blue), Kc specific or no difference (for DPR ≤ 0, yellow). The percentile of transcripts not expressed in the salivary gland are in white. (C) ORC binding across the under-replicated regions in the salivary gland and the corresponding regions in Kc cells. Each of the 34 domains is displayed vertically, in the same order for ease of comparison. Each domain that is under-replicated in the salivary gland was divided into 100 windows, and each flanking region (the length of half the corresponding under-replicated region) was divided into 50 windows. Blue indicates the presence of an ORC binding site in the window.


