
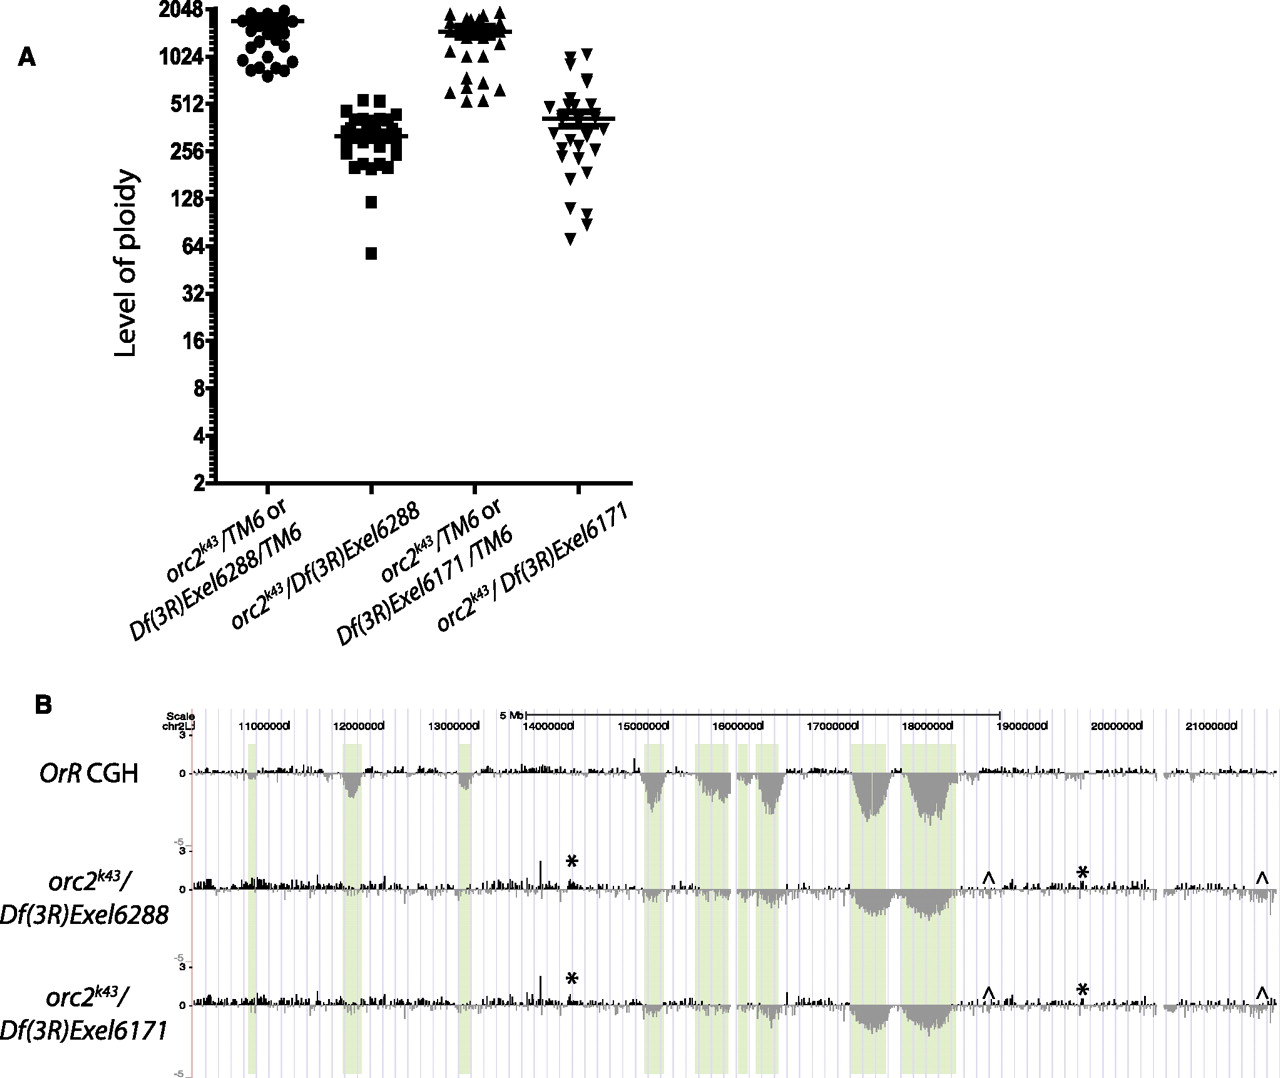
orc2 mutants have reduced ploidy levels and show increased copy number of most under-replicated regions, as well as disorganized replication. (A) Ploidy levels of orc2 mutants and heterozygous sibling controls were quantified using DAPI microdensitometry. The intensity of DAPI staining was measured relative to diploid cells to calculate their ploidy. Each symbol represents the DAPI signal intensity from a single nucleus in two experimental replicates, and the bar is the mean of the measured nuclear values. (B) aCGH was performed comparing DNA of orc2k43/Df(3R)Exel6288 and orc2k43/Df(3R)Exel6171 third-instar salivary glands with that of diploid embryo. Oregon-R (OrR) aCGH is shown for comparison. The baseline of each aCGH is based on the average of all points on the array, so that the baseline of the orc mutant aCGHs is fourfold below that of the OrR aCGH shown. Plotted is the mean probe intensity. The asterisk marks examples of disordered but experimentally consistent overreplication, whereas the ^ symbol indicates disorganized but reproducible under-replication.


