
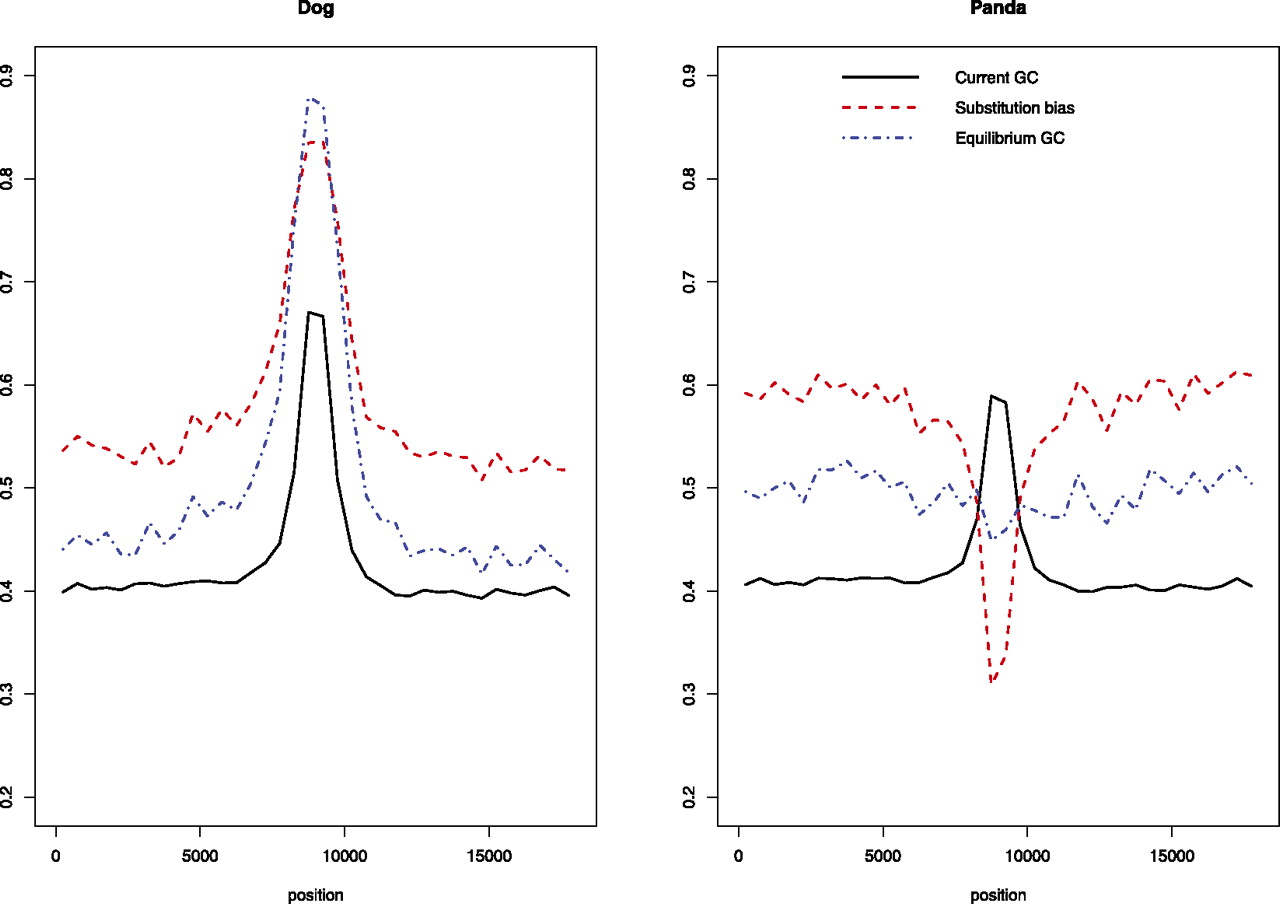
The molecular evolution of GC peaks in the dog and panda. Three hundred nine GC peaks for which we had alignment data for the dog, panda, and cat were centered in 18-kb windows prior to analyses. We used a sliding window of 500 bp to estimate average values of three different parameters related to the evolution of base composition near GC peaks in the dog and panda. First, solid black lines depict the average current GC content. Second, red lines show the nucleotide substitution bias (SB = WS/[WS + SW], where numbers of strong-to-weak [GC-to-AT] and weak-to-strong [AT-to-GC] substitutions are SW and WS, respectively). Third, blue lines show the equilibrium GC content (GC* = u/[u + v], where the rate of strong-to-weak [GC-to-AT] and weak-to-strong [AT-to-GC] substitutions are u and v, respectively).


