
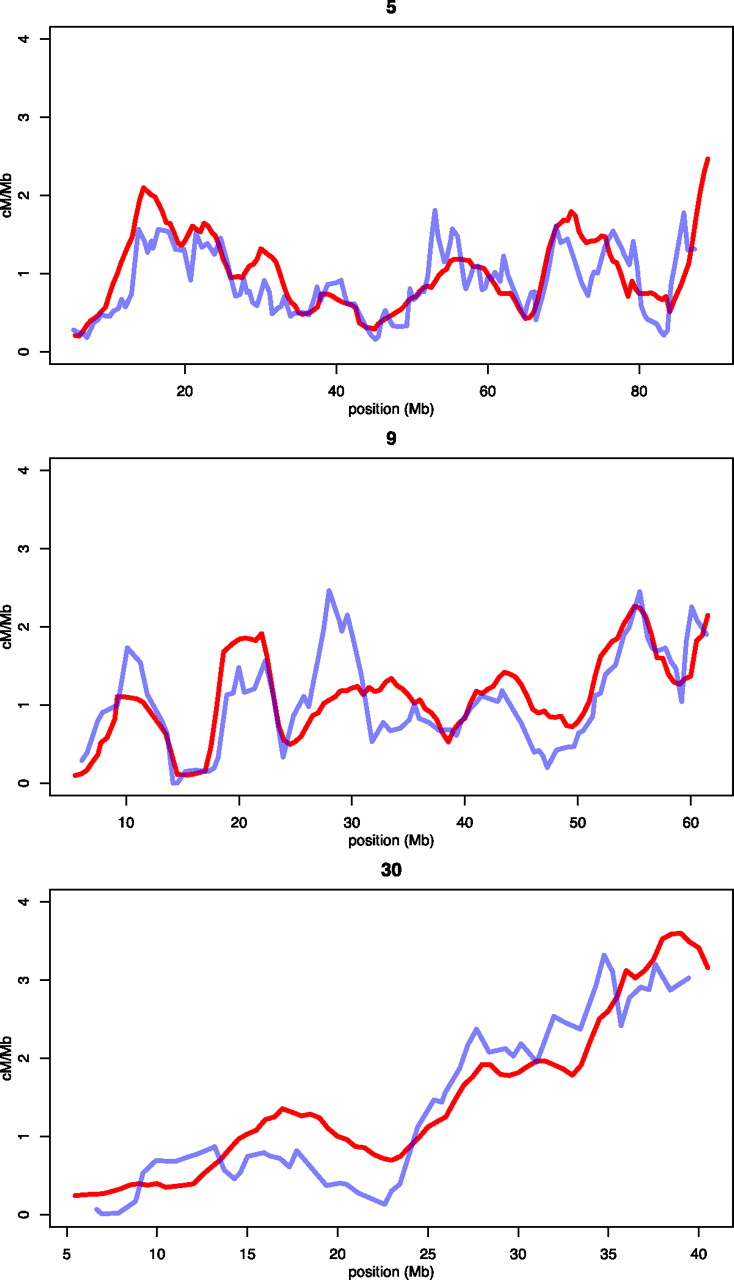
Figure 5.
Comparing recombination rates in the LD-based recombination map and a previously published linkage map for chromosomes 5, 9, and 30. Recombination rates of the linkage map (blue lines) and our LD-based inference (red lines) have been averaged across 5-Mb windows prior to plotting. We rescaled population genetic estimates by estimating the effective population size (Ne) of the dog from comparing the complete extension of the overlapping portions of the two complete recombination maps.


