
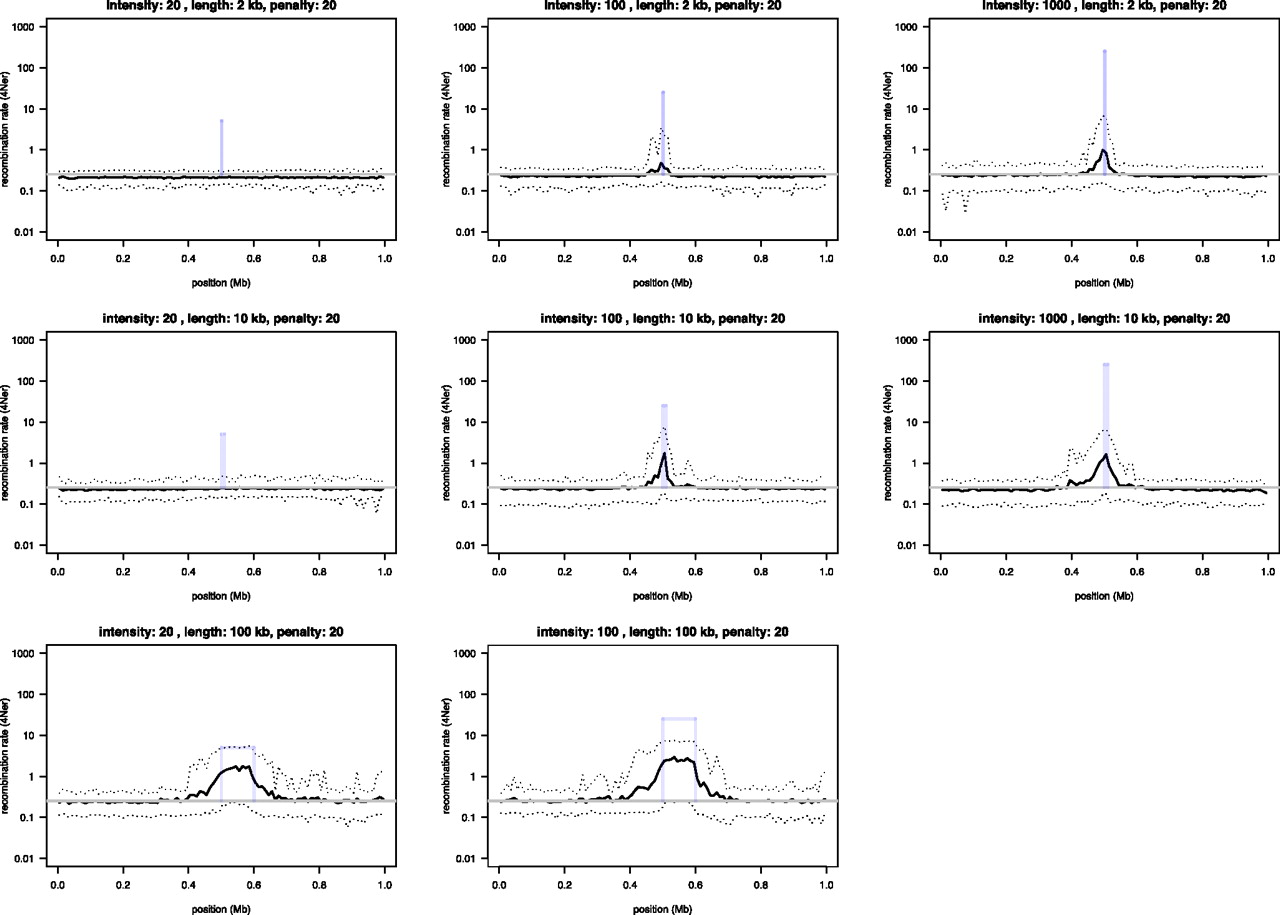
Power simulations to test the ability of interval to infer recombination rate variation in the dog. By using a realistic demographic model, we generated genotype data for 1-Mb regions centered around a hotspot of recombination with known intensity and width. Recombination rates outside the hotspot were kept uniform. Nine different scenarios were simulated in which hotspot intensity that varied from weak (20× background rate), to intermediate (100× background rate), to strong (1000× background rate) were combined with three different hotspot widths (2, 10, and 100 kb). We set interval to penalize rate change (bp = 20) and inferred recombination rates in 100 simulated data sets for each scenario, and compared the average inferred rate (solid black line) to the uniform background rate (gray solid line), as well as the hotspot intensity (solid blue bars) used in the simulations. Dotted lines show the 2.5 and 97.5 percentiles of the sampling distribution.


