
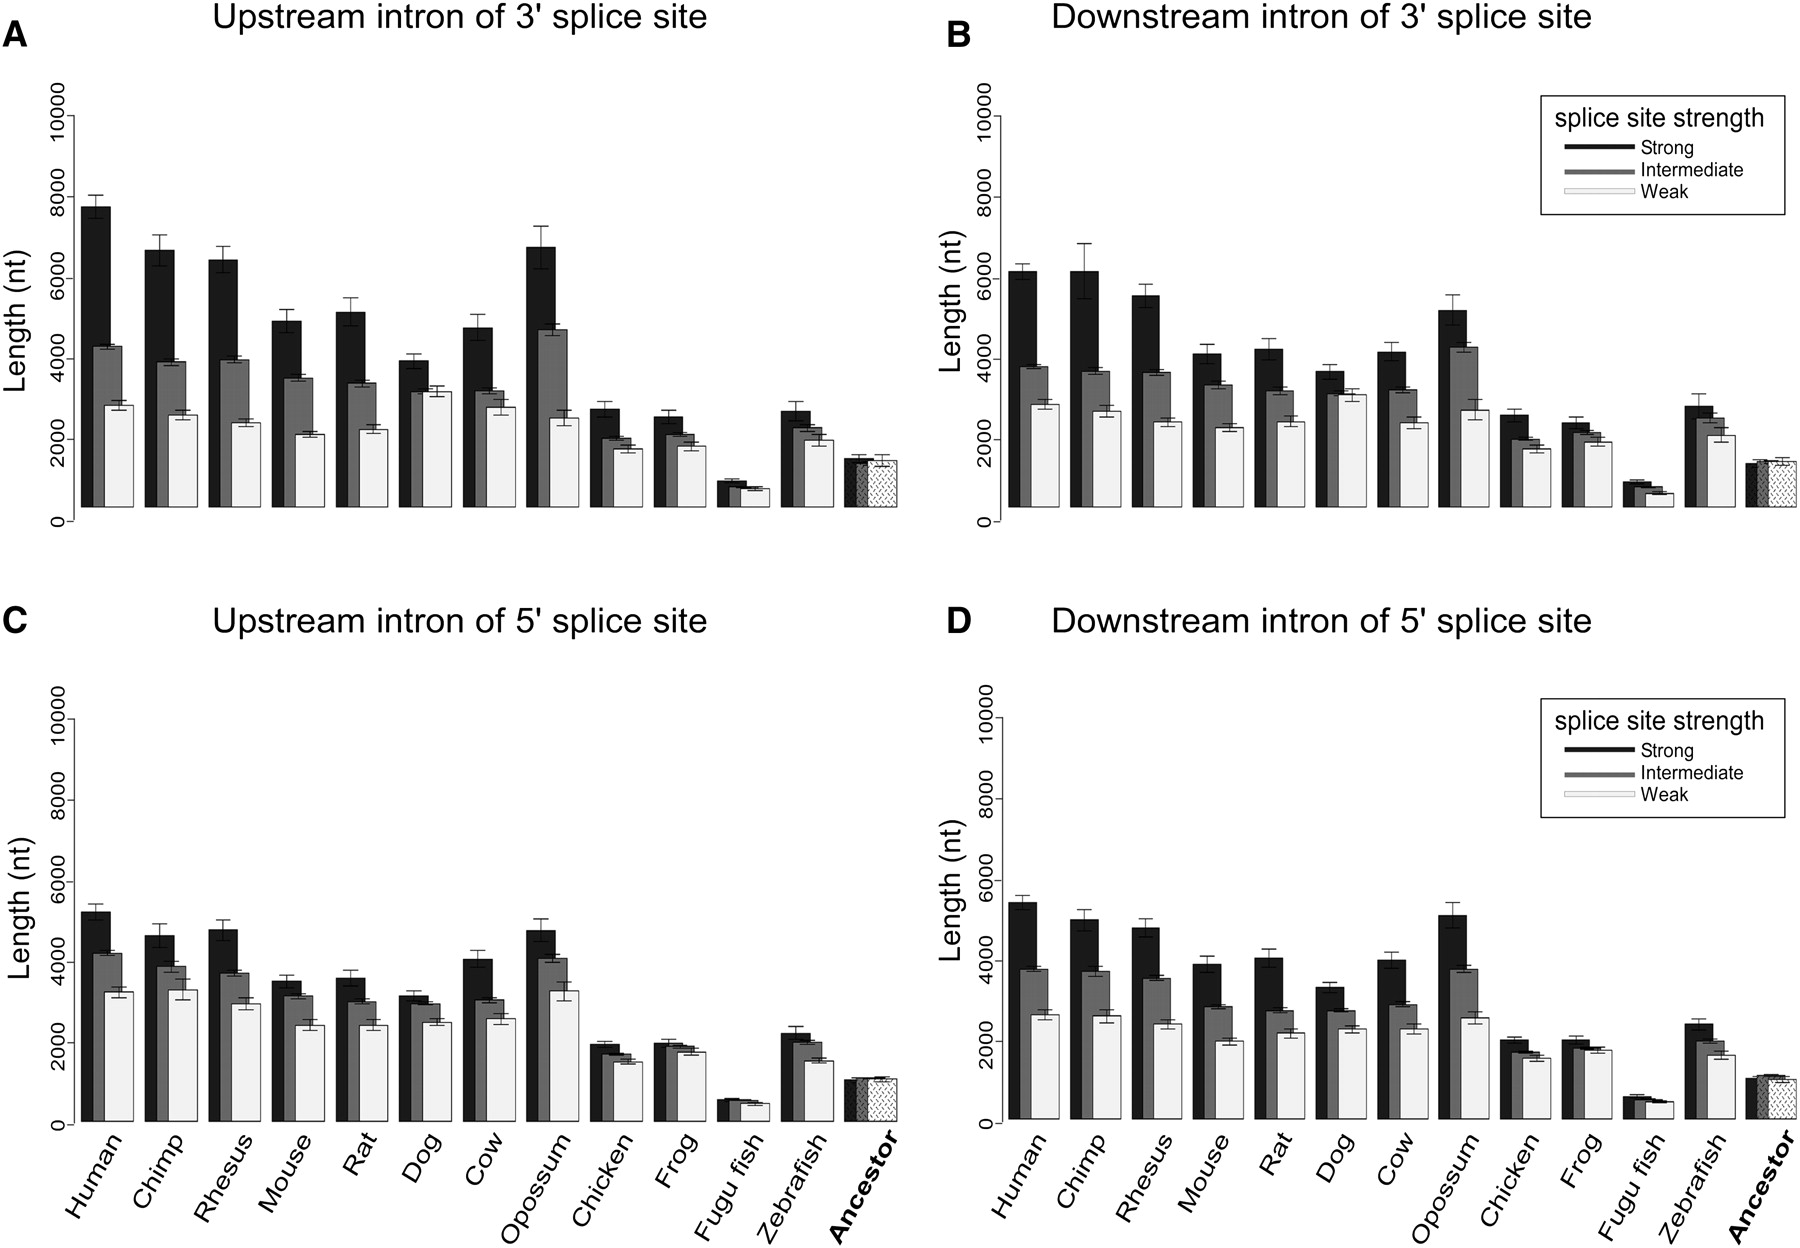
Figure 3.
Constitutive flanking introns’ length with relation to splice site strength for 12 species. Upstream (A) and downstream (B) introns that flank constitutive exons were divided into three groups based on 3′ss strength: strong splice site (black), intermediate splice site (gray), and weak splice site (white). Same as for A and B, but for upstream (C) and downstream (D) introns based on 5′ss strength. The reconstructed ancestral lengths are plotted in the right-most column.


