
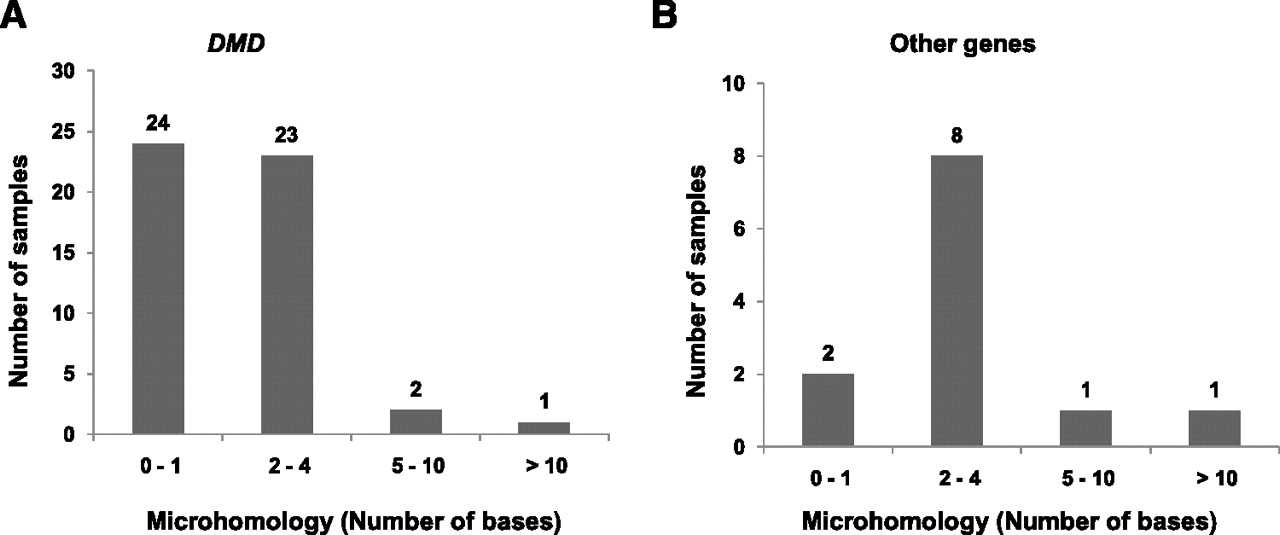
Figure 3.
The presence of microhomologies at breakpoint junctions. The graphs represent the extent of microhomologies at the deletion breakpoint junction sequences in DMD (A) and other genes (B). The x-axis represents the number of bases homologous in both junction sequences of a deletion. The y-axis represents the number of samples that have been observed to have the indicated microhomology.


