
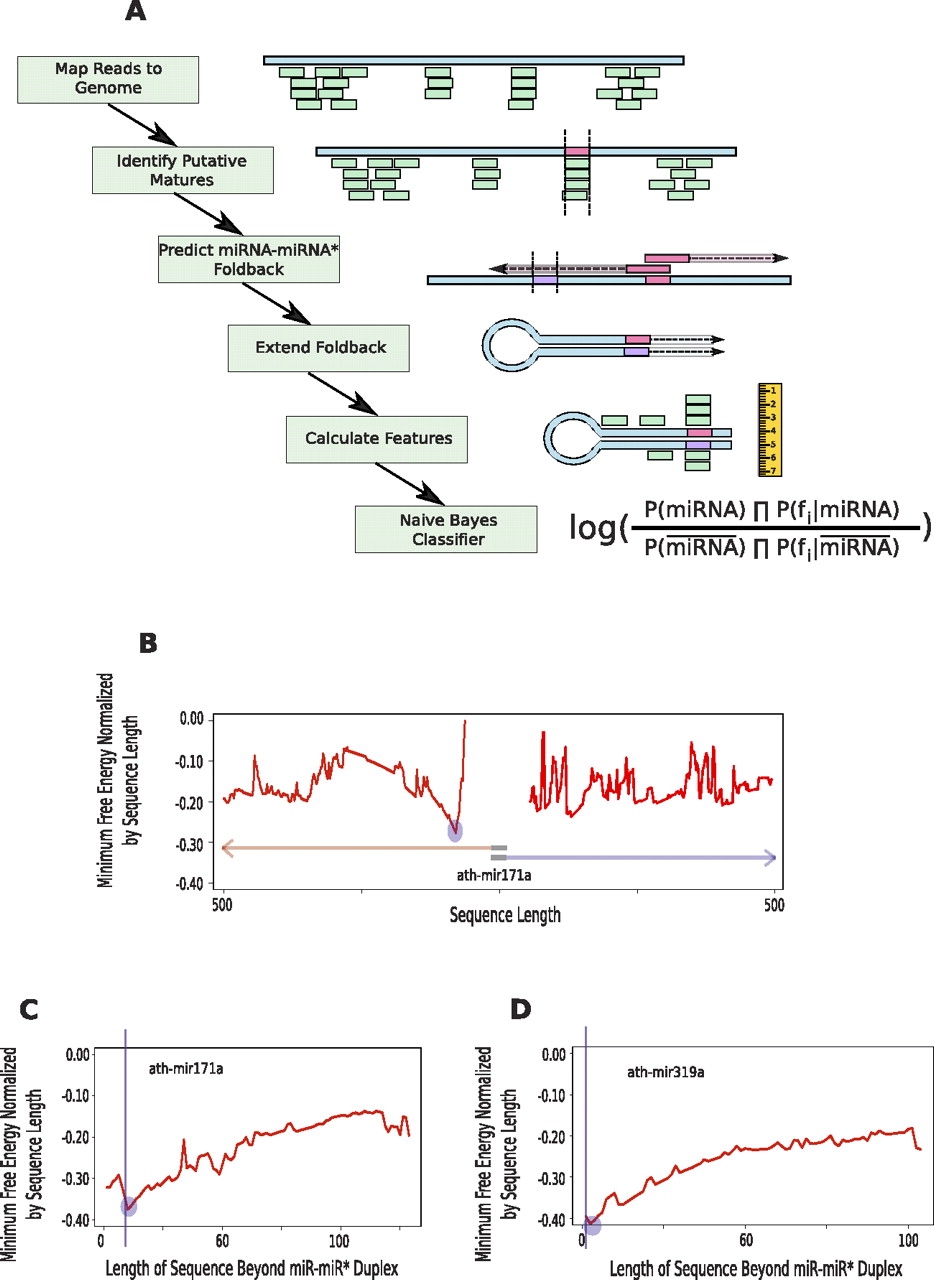
PIPmiR pipeline. (A) A schematic depiction of each step of the PIPmiR pipeline. (B) The minimum normalized free energy by sequence length calculated while determining the miRNA–miRNA* foldback structure for ath-mir171a. The blue circle highlights the sequence with the overall minimum value that was used in the subsequent step. (C,D) The minimum normalized free energy by sequence length calculated while extending the miRNA–miRNA* foldback structure for ath-mir171a and ath-mir319a, respectively. The blue circles highlight the location identified by PIPmiR as the correct foldback structure. The vertical blue lines represent the sequence identified as necessary for the proper processing of the miRNA.


