
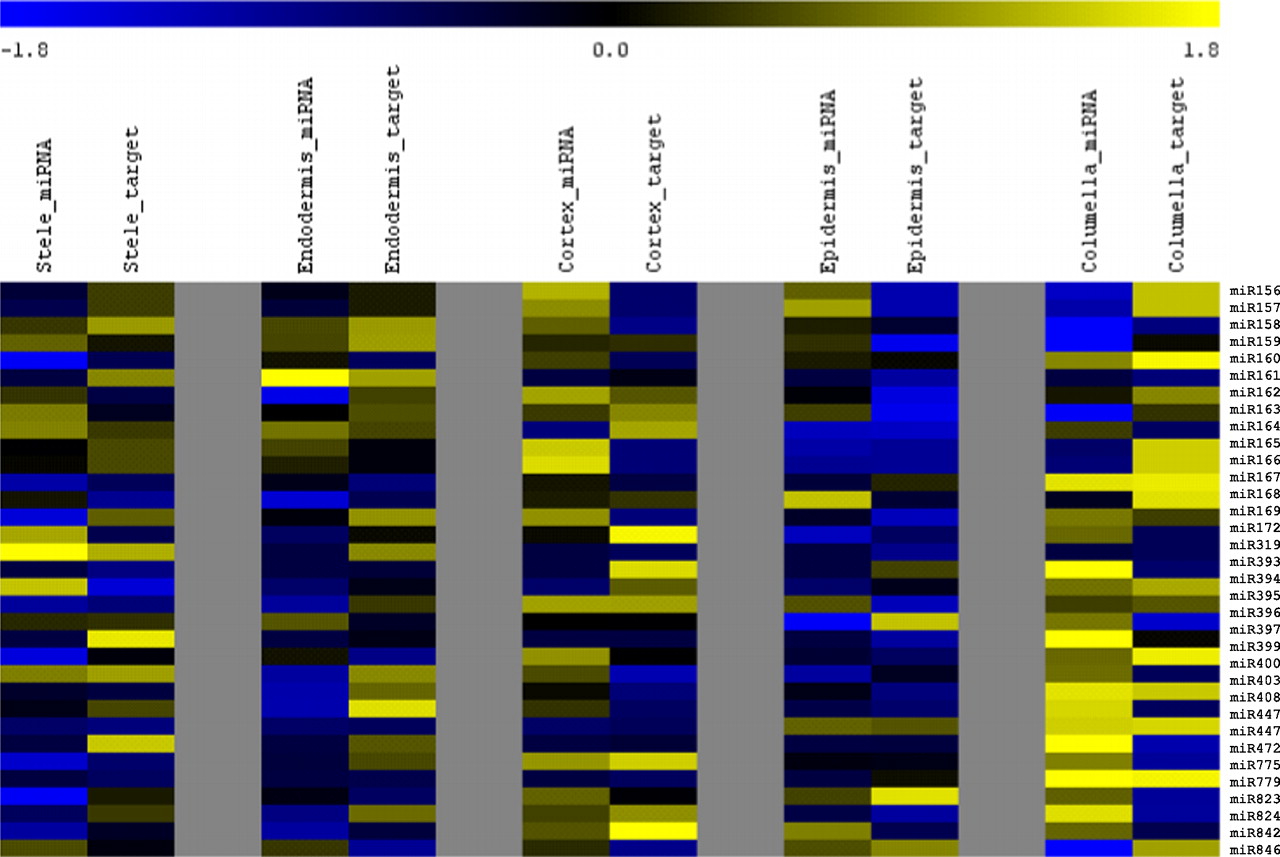
Figure 3.
Expression of miRNAs and their validated targets varies by cell type and developmental zone. Heat map representation of known miRNA expression and average miRNA target expression z-scores side by side for each of the cell types. An inverse relationship between the expression level of miRNAs and their validated targets was found for many known miRNAs. (Yellow) High expression; (blue) low expression.


