
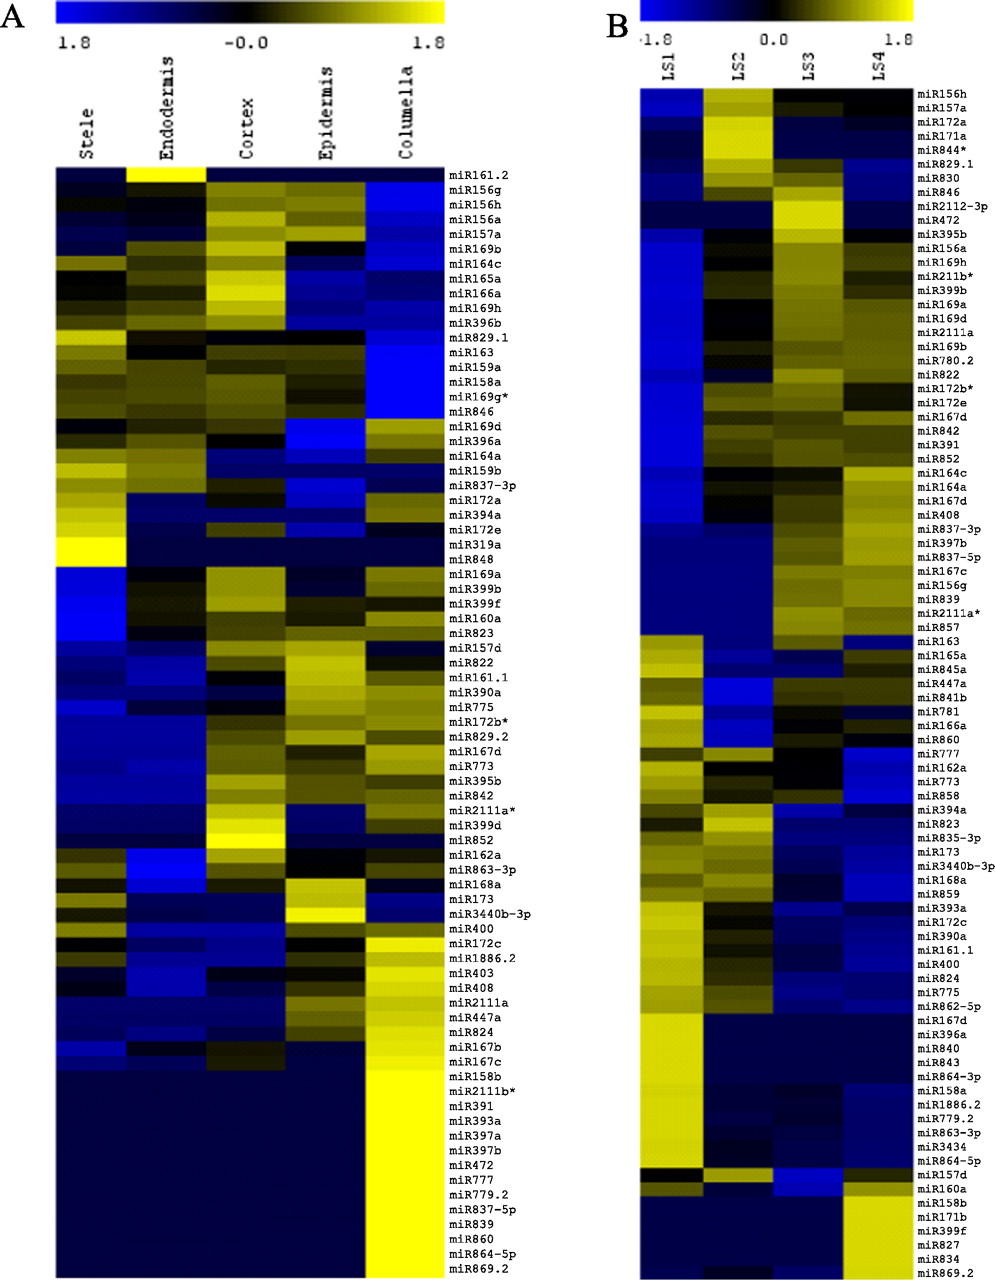
Cell type– and developmental zone–specific enrichment of known miRNAs. MiRNA expression profiles from the radial data sets represented as heat maps. (Yellow) Enrichment; (blue) under-representation. (A) Radial expression map, in which columns are cell types and rows are mature miRNAs. Note that some miRNAs are enriched in only one cell type, while others are enriched in multiple cell types. Individual clusters are shown in more detail in Supplemental Figure 1. (B) Developmental zone expression map, in which columns are developmental zones and rows are mature miRNAs. Note that some miRNAs are enriched in a specific developmental zone, while other miRNAs are under-represented in specific developmental zones. Individual clusters are shown in more detail in Supplemental Figure 2. The miRNAs listed are the representative members of the family as listed in Supplemental Figure 10.


