
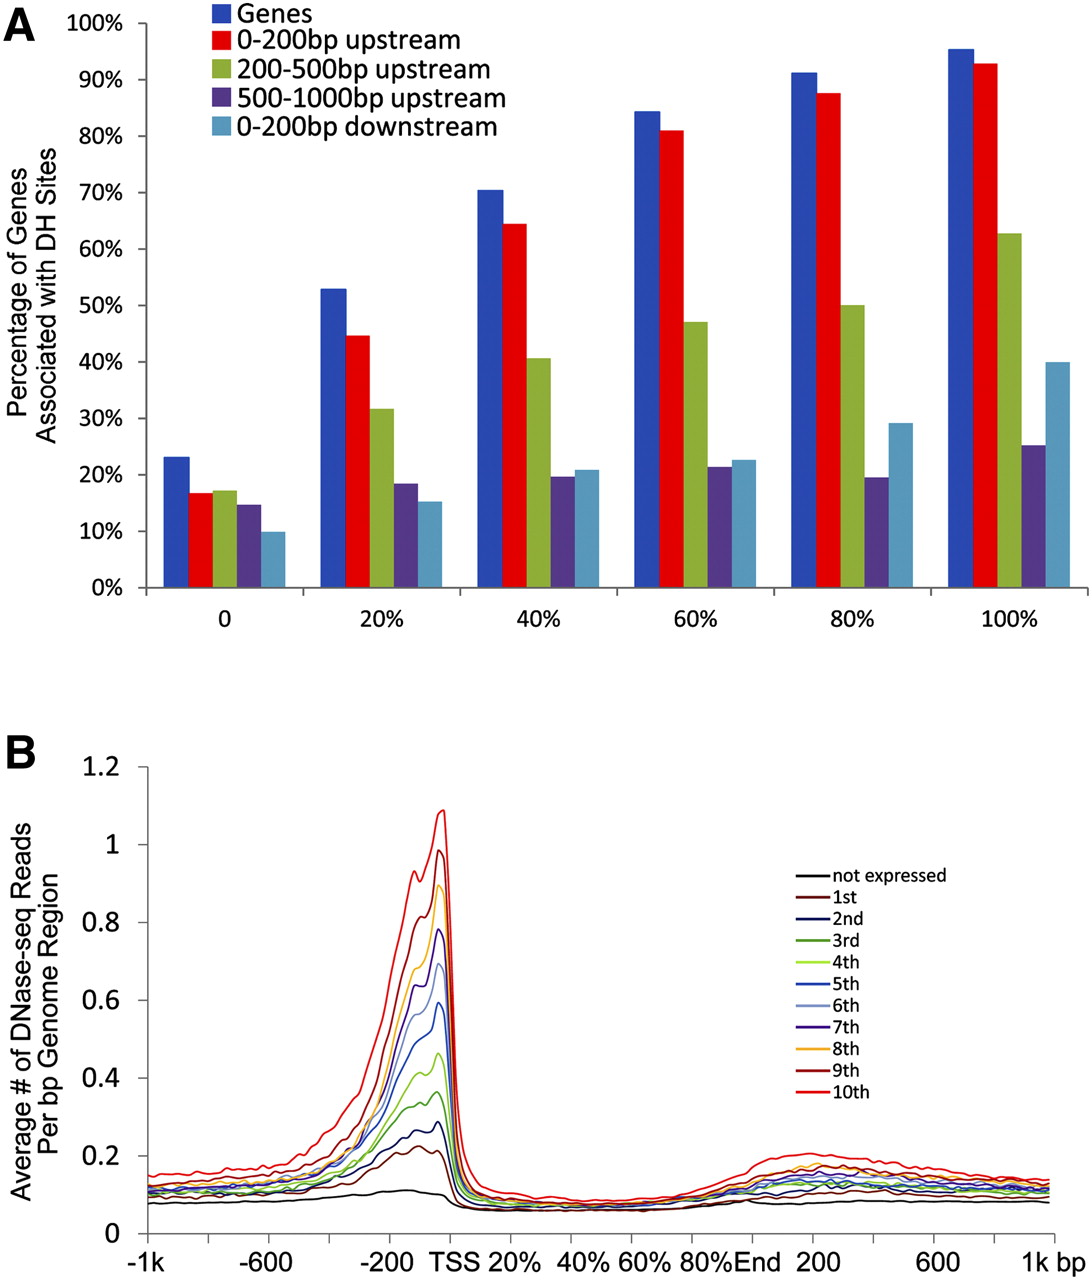
The relationship between DNase I sensitivity and the levels of gene expression in seedling tissue. (A) The percentage of genes with different expression levels (based on RNA-seq data, FPKM) associated with DH sites in different locations (from 1-kp upstream regions of genes to 200-bp downstream regions of genes). Genes were divided into six bins based on their expression levels, including no expression (FPKM = 0), and from bottom 20% to top 20% (indicated as 100% in figure). (B) The profile of DNase I sensitivity (indicated by the number of DNase-seq reads) among the genes with different expression levels. The expressed genes were divided into 10 bins from low expression (first) to high expression (10th) based on the expression levels.


