
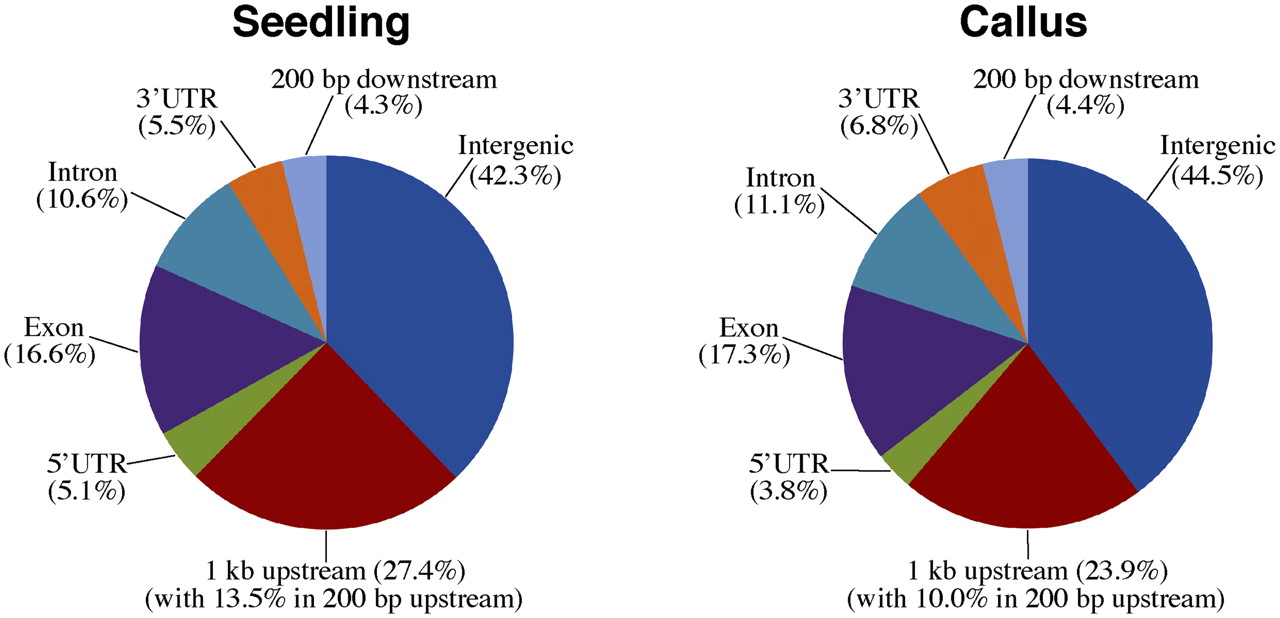
Figure 4.
Distribution of DH sites in the rice genome. (1 kb upstream) 1-kb region upstream of TSS. (200 bp downstream) 200-bp region downstream from the end of gene transcription.
(Downloading may take up to 30 seconds. If the slide opens in your browser, select File -> Save As to save it.)
Click on image to view larger version.
Distribution of DH sites in the rice genome. (1 kb upstream) 1-kb region upstream of TSS. (200 bp downstream) 200-bp region downstream from the end of gene transcription.
 CiteULike
 Delicious
 Digg
Digg Facebook
 Google+
 Reddit
 Twitter
