
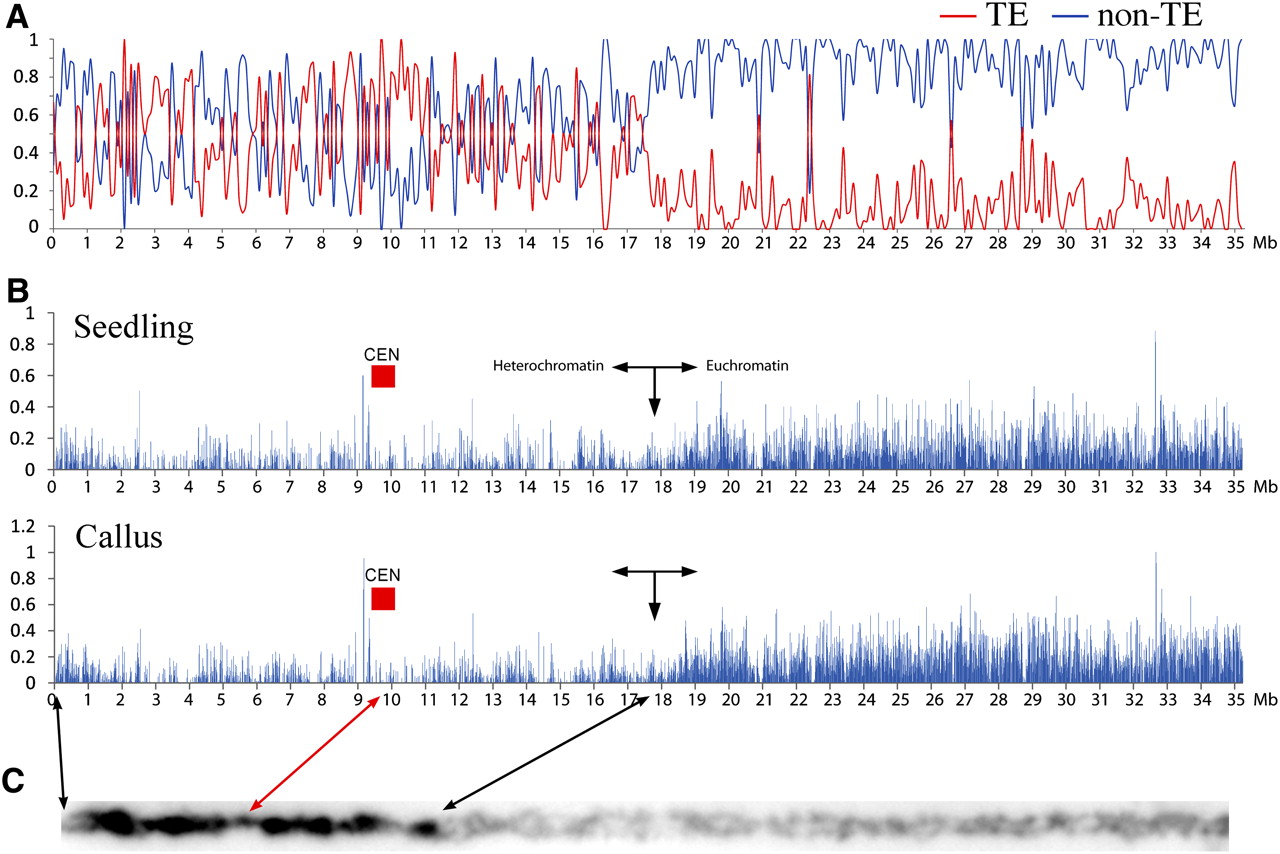
Distribution of DH sites on rice chromosome 4. (A) Distribution of transposable element (TE)–related genes and non-TE genes along rice chromosome 4 (35 Mb). y-axis indicates the ratio of TE genes (red line) and non-TE genes (blue line) to total genes in 10 kb windows. (B) Distribution of DH sites on rice chromosome 4. y-axis indicates the coverage of the DH sites, which was calculated as the percentage of mappable regions covered by DH sites in 10-kb non-overlapped window bins. Red boxes (CEN) indicate the positions of the centromeres (Yan et al. 2008). (C) A digitally straightened pachytene chromosome 4. The chromosome was stained by DAPI and was converted into a black–white image to enhance the differentiation between heterochromatin (dark color) and euchromatin (light color). The positions of the centromere and the euchromatin-heterochromatin boundary on the long arm are marked by arrows.


