
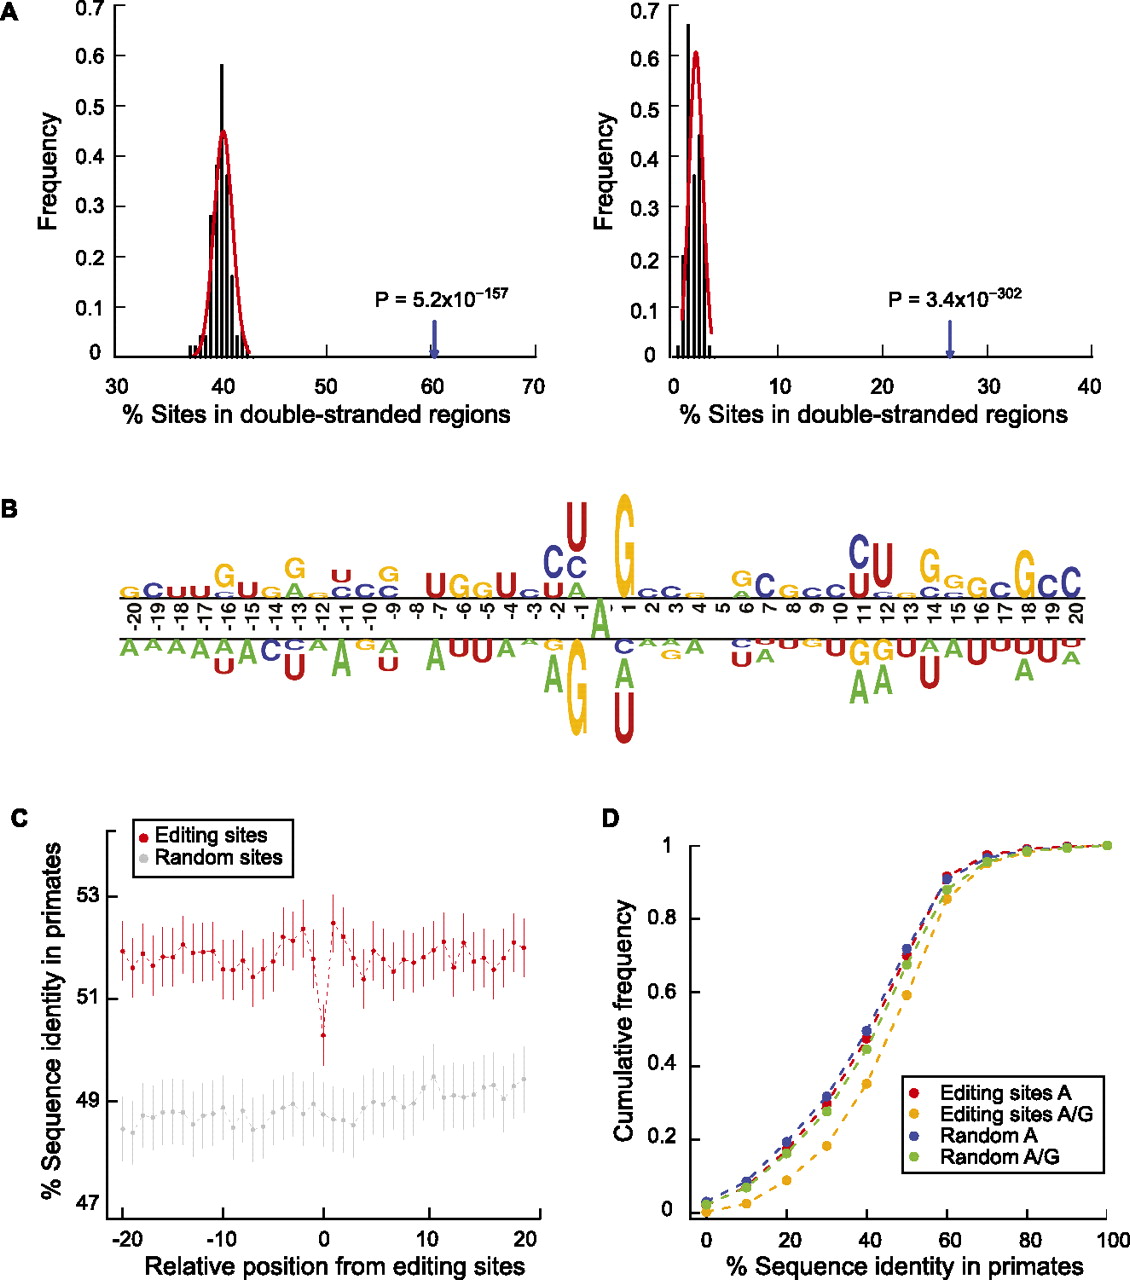
Sequence features of predicted A-to-I editing sites and the flanking regions. (A) Double-stranded regions in the neighborhoods of predicted A-to-I editing sites. (Left) Editing sites and controls are located in Alu elements. Controls were picked as random As in such regions with matched G+C content relative to the test regions (Supplemental Methods). Percentage of editing sites in double-stranded regions shown by arrow; percentage of control sites in double-stranded regions shown by black histogram. P-value was calculated by fitting a normal distribution to the control histogram. (Right) Same as the left panel, but editing sites and controls are outside of Alu elements. (B) Sequence preferences for base positions flanking predicted A-to-I editing sites. Editing sites (the A nucleotide at position 0) are aligned together. Sequence preference is represented using a two-sample logo program (Vacic et al. 2006). (C) Conservation of the immediate neighborhood of predicted A-to-I editing sites. Sequence conservation (percentage of identity) of each position flanking editing sites was calculated using the UCSC multiz46way alignments of primate genomes (Supplemental Methods). Random controls were picked for each editing site in the same type of regions (e.g., Alus in coding exons, Alus in introns). Vertical lines represent 95% confidence intervals. (D) Sequence conservation among primates at the edited sites before and after editing. Cumulative distribution functions are shown for percentage of identity at the editing sites assuming the nucleotide being A and (A or G) in human, respectively. Random controls were picked similarly as described in C.


