
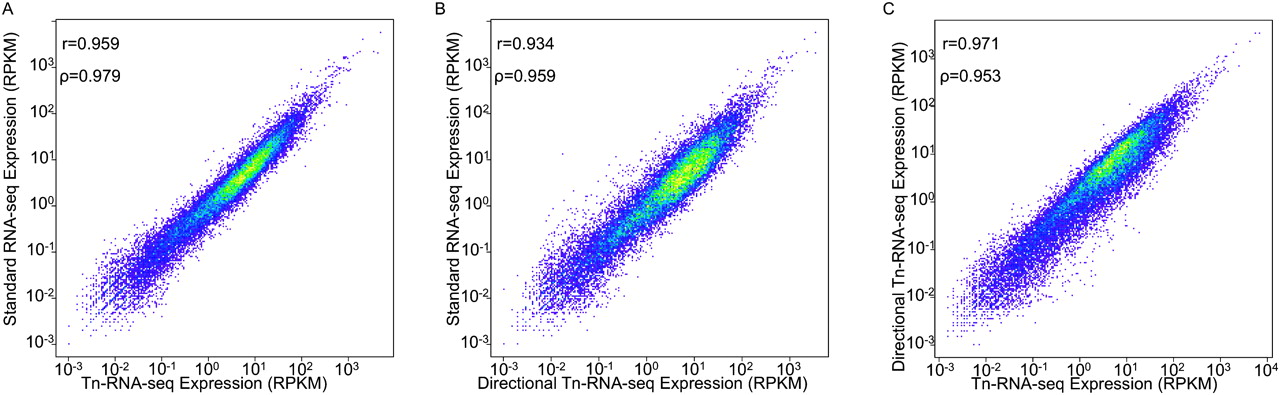
Expression values are consistent between standard RNA-seq library construction and transposon-based RNA-seq library construction in ECC-1. (A) Scatterplot showing expression values for standard RNA-seq library construction (y-axis) and the Tn–RNA-seq library construction (x-axis). The Pearson correlation between the standard and Tn–RNA-seq protocols is 0.959, and the Spearman rank correlation is 0.979. (B) Scatterplot displaying expression values for standard RNA-seq library construction (y-axis) and the directional Tn–RNA-seq library construction (x-axis). The Pearson correlation between the standard and directional Tn–RNA-seq protocols is 0.934, and the Spearman rank correlation is 0.959. (C) Scatterplot displaying expression values for Tn–RNA-seq library construction (x-axis) and the directional Tn–RNA-seq library construction (y-axis). The Pearson correlation between the Tn–RNA-seq and directional Tn–RNA-seq protocols is 0.971, and the Spearman rank correlation is 0.953.


