
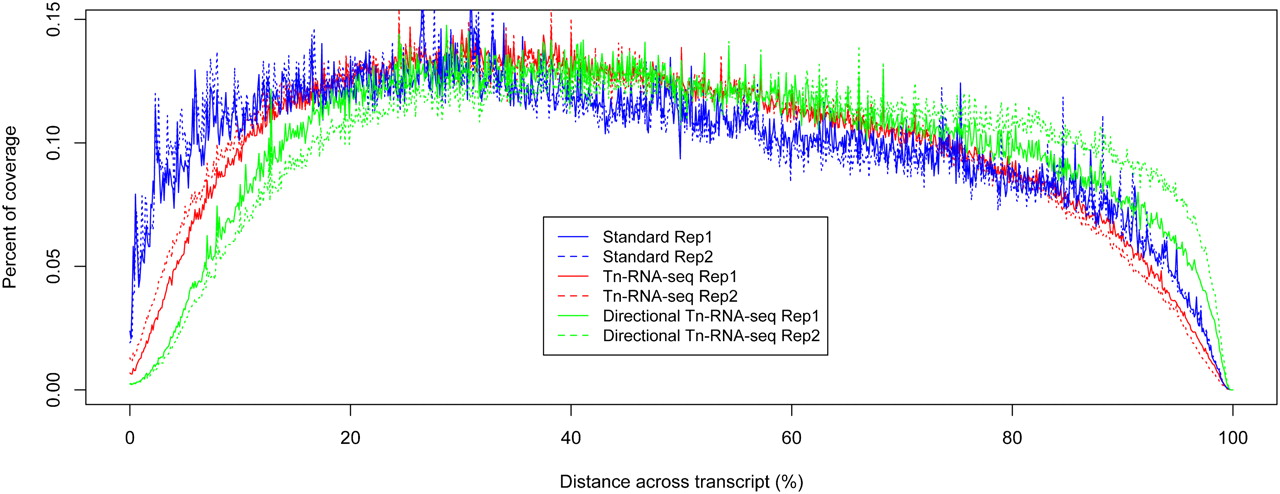
Figure 3.
Transposon-based libraries show expected depletion of coverage at 5′ ends of transcripts. The percentage of coverage (y-axis), averaged across all transcripts is plotted as a function of distance across the transcripts (x-axis). 0% corresponds to the 5′ ends and 100% corresponds to the 3′ ends of transcripts.


