
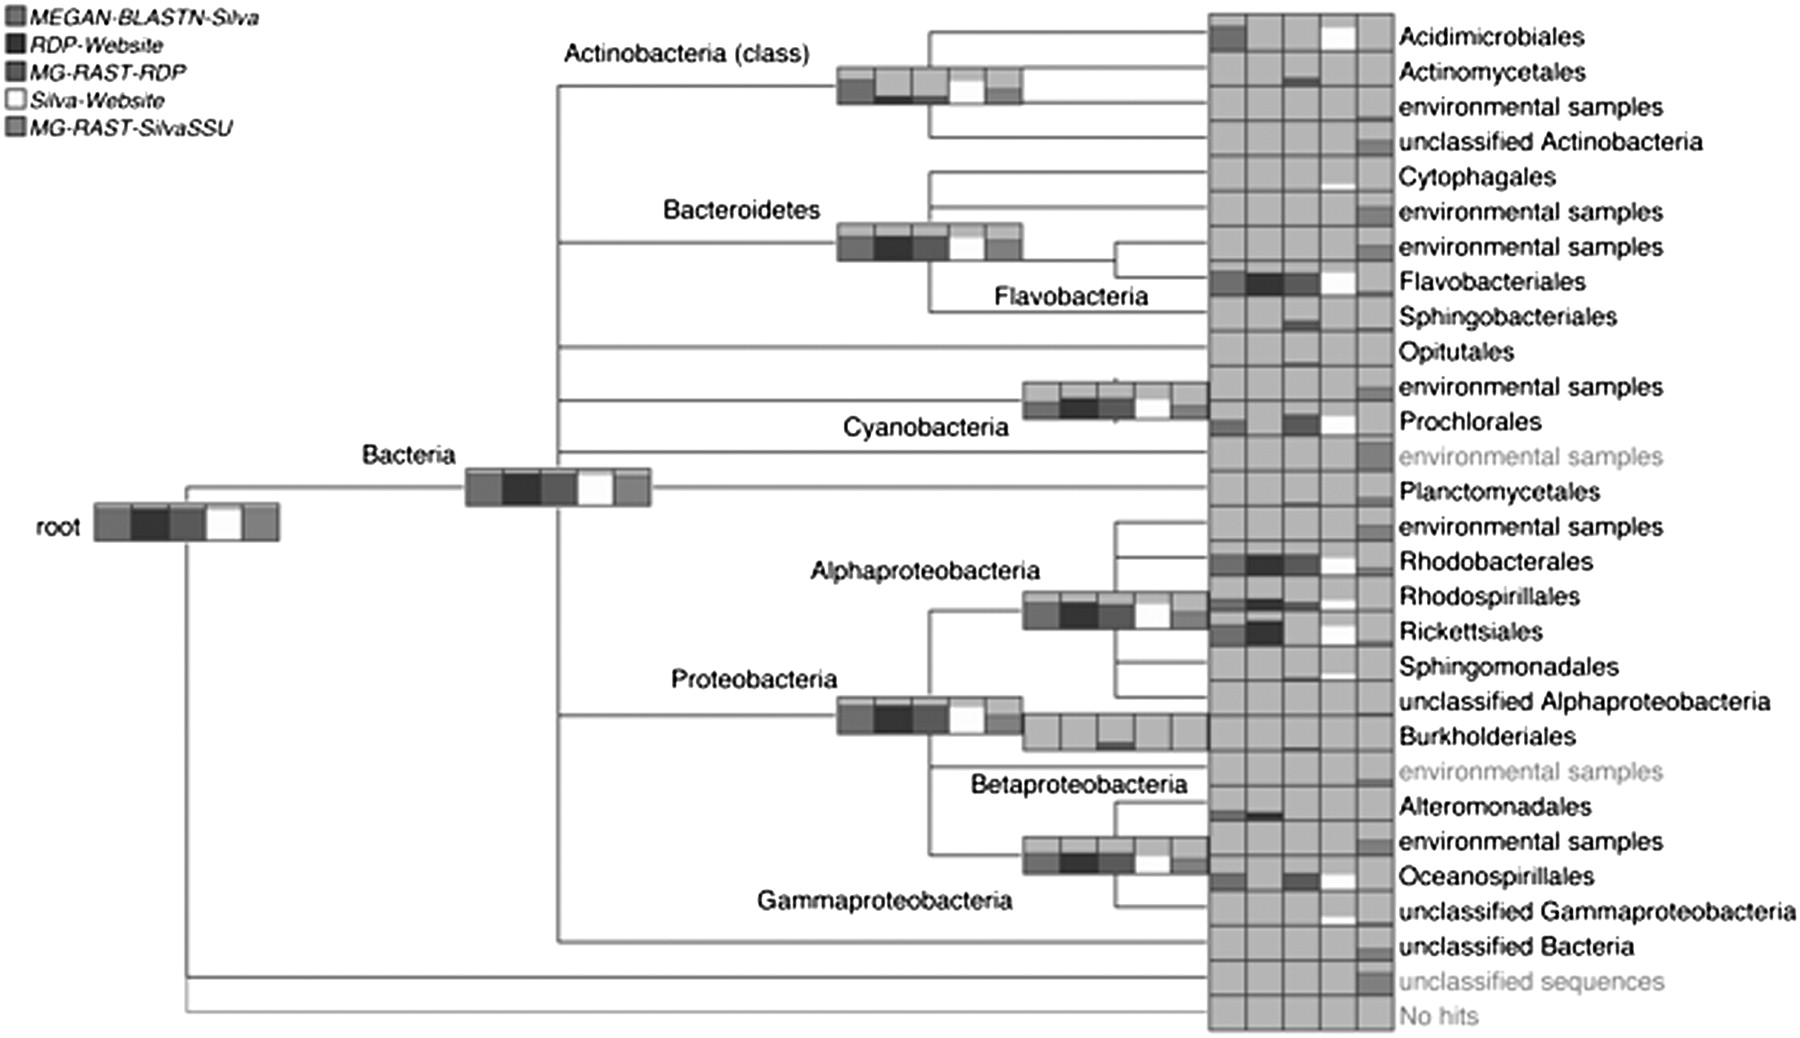
Figure 7.
Comparison of the taxonomic analysis of a 16S rRNA data set (Morris et al. 2010), computed using five different approaches: MEGAN4's BLASTN-based SILVA analysis, the RDP website's classifier (Cole et al. 2009), MG-RAST's RDP-based approach (Glass et al. 2010), the SILVA website's aligner (Pruesse et al. 2007), and MG-RAST's SILVA-based approach targeting the SSU gene. In this figure, the bar charts on higher-rank nodes reflect the total number of reads assigned to the corresponding node or to any of the nodes in the subtree below the node.


