
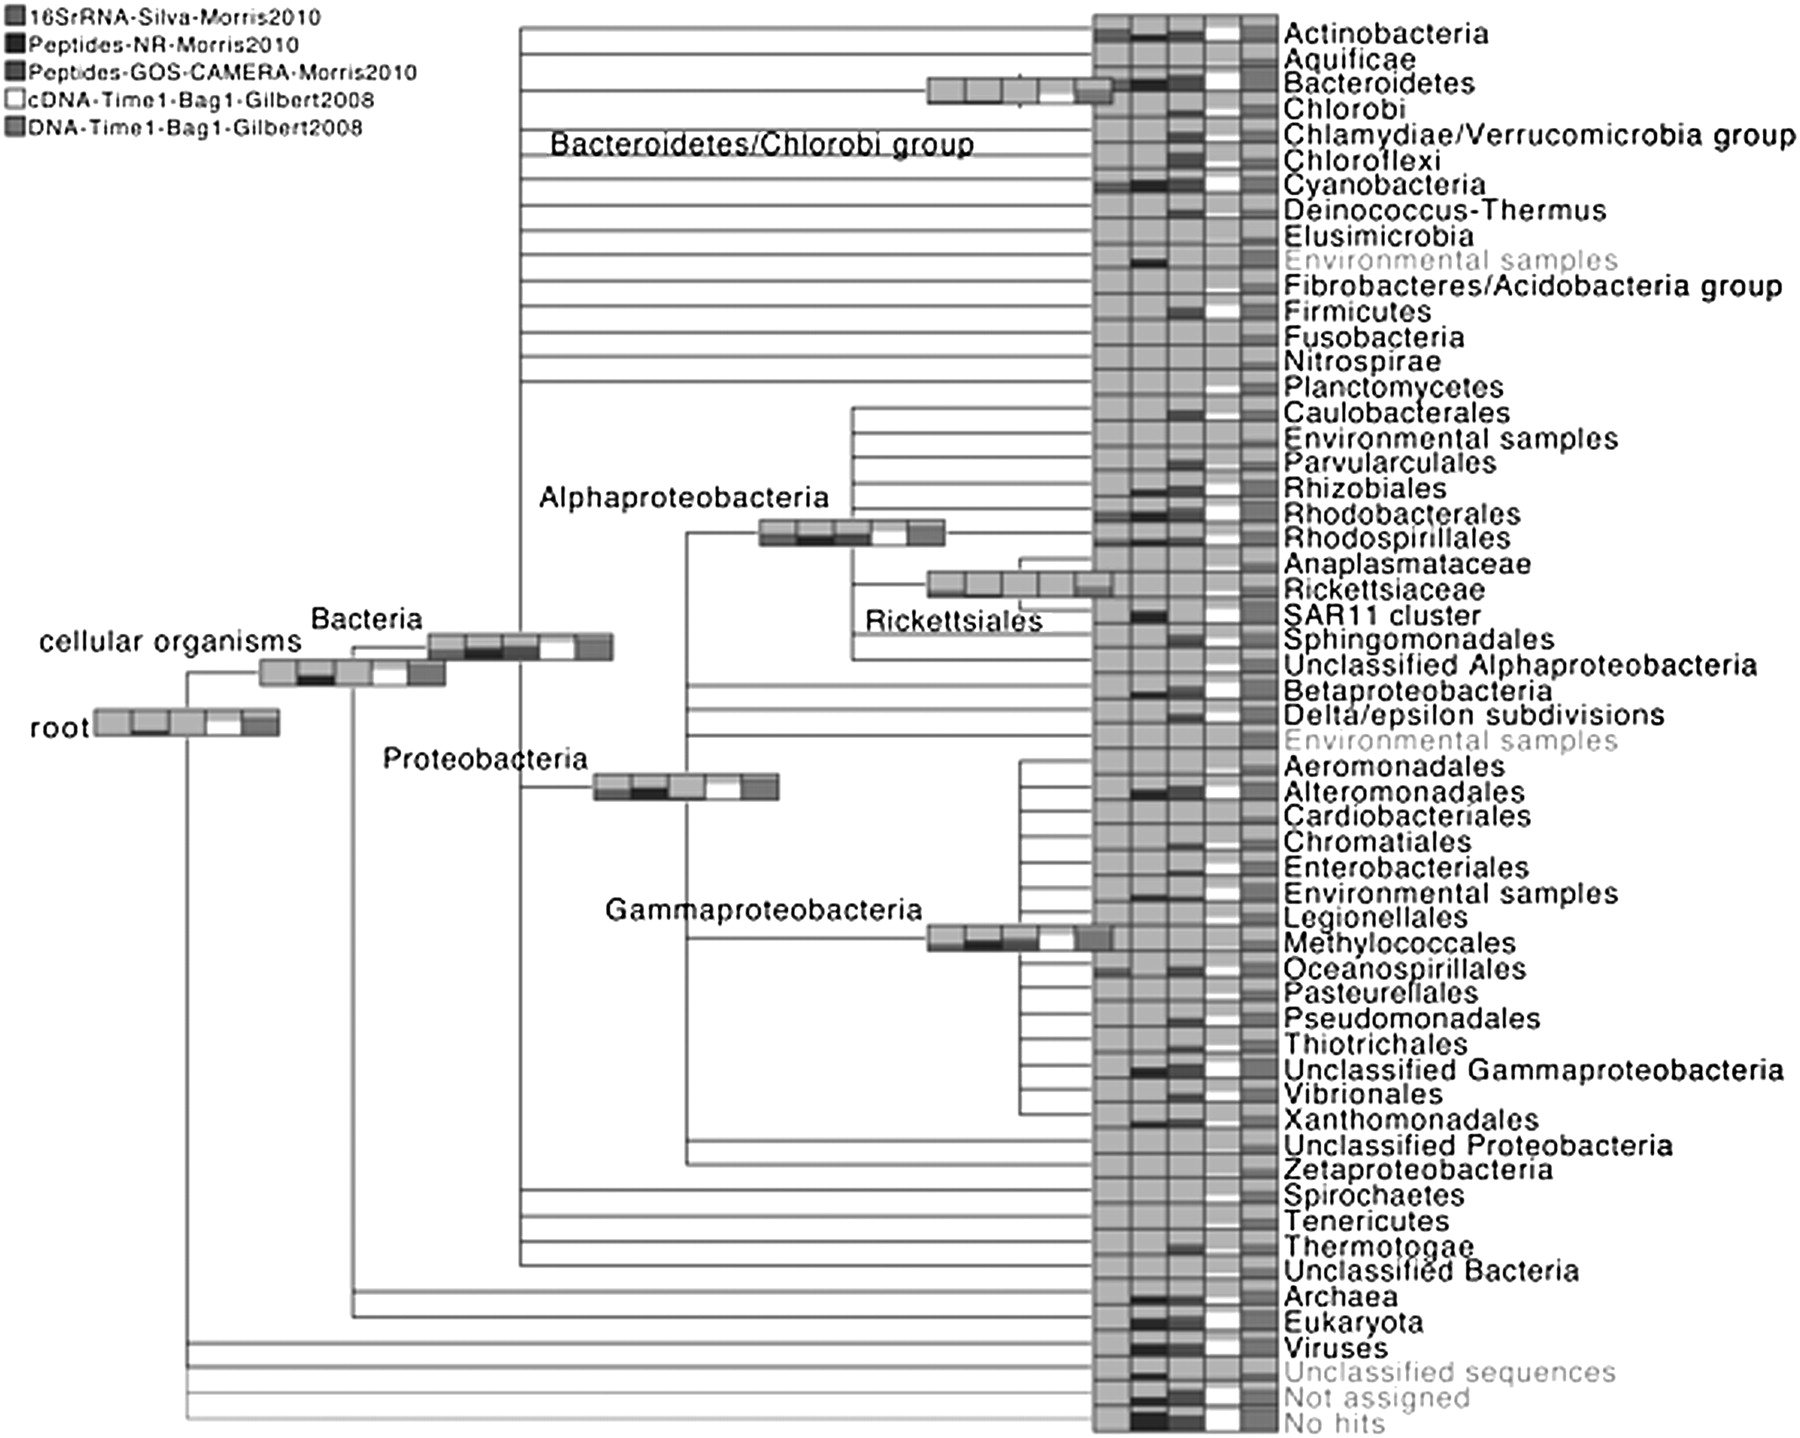
MEGAN4 integrative taxonomic analysis of a 16S rRNA data set (labeled “16SrRNA-Silva-Morris2010”) and two different analyses of a metaproteome (labeled “Peptides-NR-Morris2010, and Peptides-GOS-CAMERAMorris2010”), all from Morris et al. (2010), combined with a metatranscriptome and metatranscriptome from Gilbert et al. (2008) (labeled “cDNA-Time1-Bag1-Gilbert2008 and DNA-Time1-Bag1-Gilbert2008,” respectively). The results labeled Peptides-NR-Morris2010 were obtained by a MEGAN analysis based on a comparison against the NR database, whereas those labeled Peptides-GOS-CAMERA-Morris2010 were imported from Morris et al. (2010). We display the NCBI taxonomy down to the rank of Phylum and in some parts of the Proteobacteria, down to the rank of Order. In such MEGAN4 diagrams, each taxon is displayed as a gray rectangle that contains a bar chart indicating the number of reads assigned to the taxon, on a logarithmic scale.


