
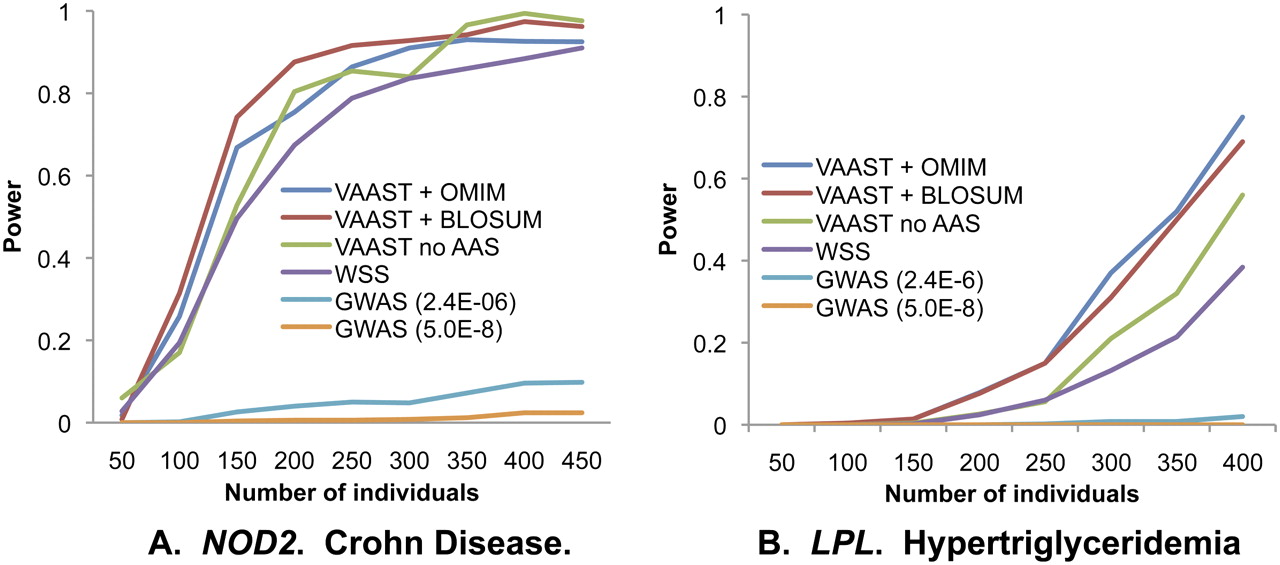
Statistical power as a function of number of target genomes for two common disease genes. (A) NOD2, using a data set containing rare and common nonsynonymous variants. (B) LPL, using a data set containing only rare nonsynonymous variants. For each data point, power is estimated from 500 bootstrapped resamples of the original data sets, with α = 2.4 × 10⁻⁶ except where specified. y-axis: probability of identifying gene as implicated in disease in a genome-wide search; x-axis: number of cases. The number of controls is equal to the number of cases up to a maximum of 327 for LPL (original data set) and 163 for NOD2 (original data set + 60 Europeans from 1000 Genomes). (VAAST + OMIM) VAAST using AAS data from OMIM as its disease model; (VAAST + BLOSUM) VAAST using BLOSUM62 as its disease model; (VAAST no AAS) VAAST running on allele frequencies alone; (WSS) weighted sum score of Madsen and Browning (2009); (GWAS) single variant GWAS analysis. NOD2 and LPL data sets were taken from Lesage et al. (2002) and Johansen et al. (2010), respectively.


