
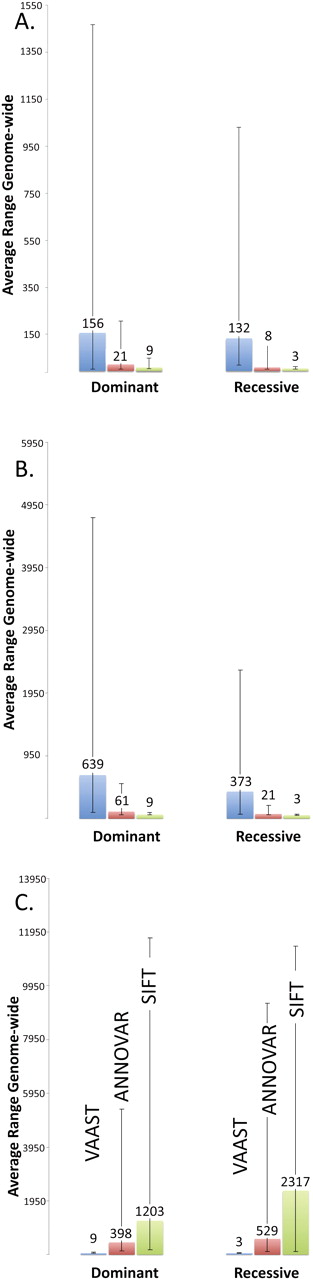
Benchmark analyses using 100 different known disease genes. In each panel the y-axis denotes the average rank of the disease gene among 100 searches for 100 different disease genes. Heights of boxes are proportional to the mean rank, with the number above each box denoting the mean rank of the disease gene among all RefSeq annotated human genes. Error bars encompass the maximum and minimum observed ranks for 95% of the trials. (A) Average ranks for 100 different VAAST searches. (Left half of panel) The results for genome-wide searches for 100 different disease genes assuming dominance using a case cohort of two (blue box), four (red box), and six (green box) unrelated individuals. (Right half of panel) The results for genome-wide searches for 100 different recessive disease genes using a case cohort of 1 (blue box), 2 (red box), and 3 (green box). (B) Impact of missing data on VAAST performance. (Left and right half of panel) Results for dominant and recessive gene searches as in panel A, except in this panel the case cohorts contain differing percentages of individuals with no disease-causing variants in the disease gene. (Blue box) Two-thirds of the individuals lack a disease-causing allele; (red box) one-third lack a disease-causing allele; (green box) all members of the case cohort contain disease-casing alleles. (C) Comparison of VAAST performance to that of ANNOVAR and SIFT. (Left half of panel) The results for genome-wide searches using VAAST, ANNOVAR, and SIFT to search for 100 different dominant disease genes using a case cohort of six unrelated individuals. (Right half of panel) The results for genome-wide searches using VAAST, ANNOVAR, and SIFT to search for 100 different recessive disease genes using a case cohort of three unrelated individuals.


