
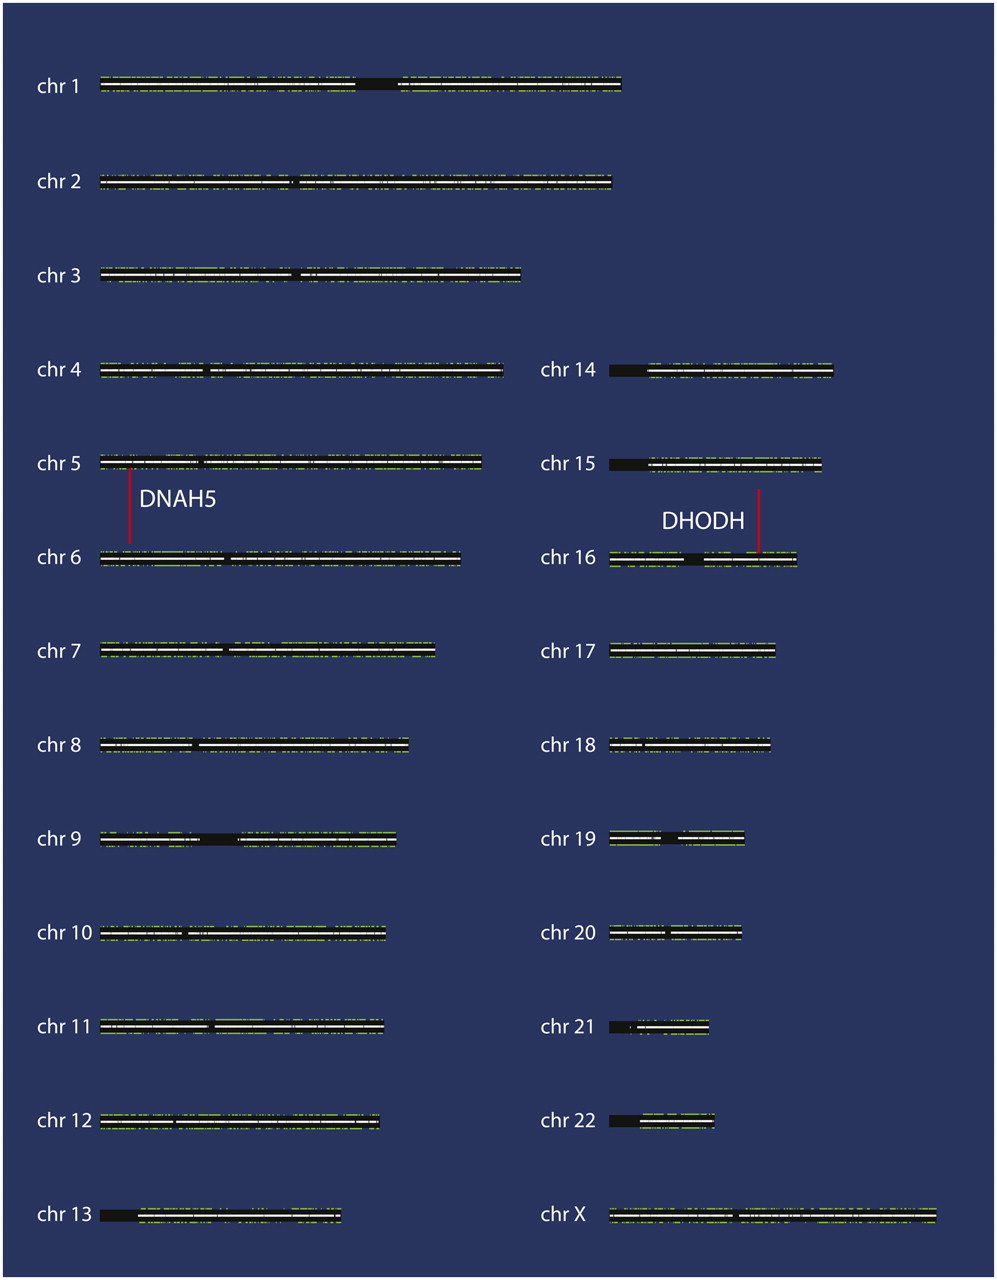
Genome-wide VAAST analysis of Utah Miller Syndrome Quartet. VAAST was run in its quartet mode, using the genomes of the two parents to improve specificity when scoring the two affected siblings. Gray bars along the center of each chromosome show the proportion of unique sequence along the chromosome arms, with white denoting completely unique sequence; black regions thus outline centromeric regions. Colored bars above and below the chromosomes (mostly green) represent each annotated gene; plus strand genes are shown above and minus strand genes below; their width is proportional to their length; height of bar is proportional to their VAAST score. Genes colored red are candidates identified by VAAST. Only two genes are identified in this case: DNAH5 and DHODH. Causative allele incidence was set to 0.00035, and amino acid substitution frequency was used along with variant-masking. This view was generated using the VAAST report viewer. This software tool allows the visualization of a genome-wide search in easily interpretable form, graphically displaying chromosomes, genes, and their VAAST scores. For comparison, the corresponding figure, without pedigree information, is provided as Supplemental Figure 1.


