
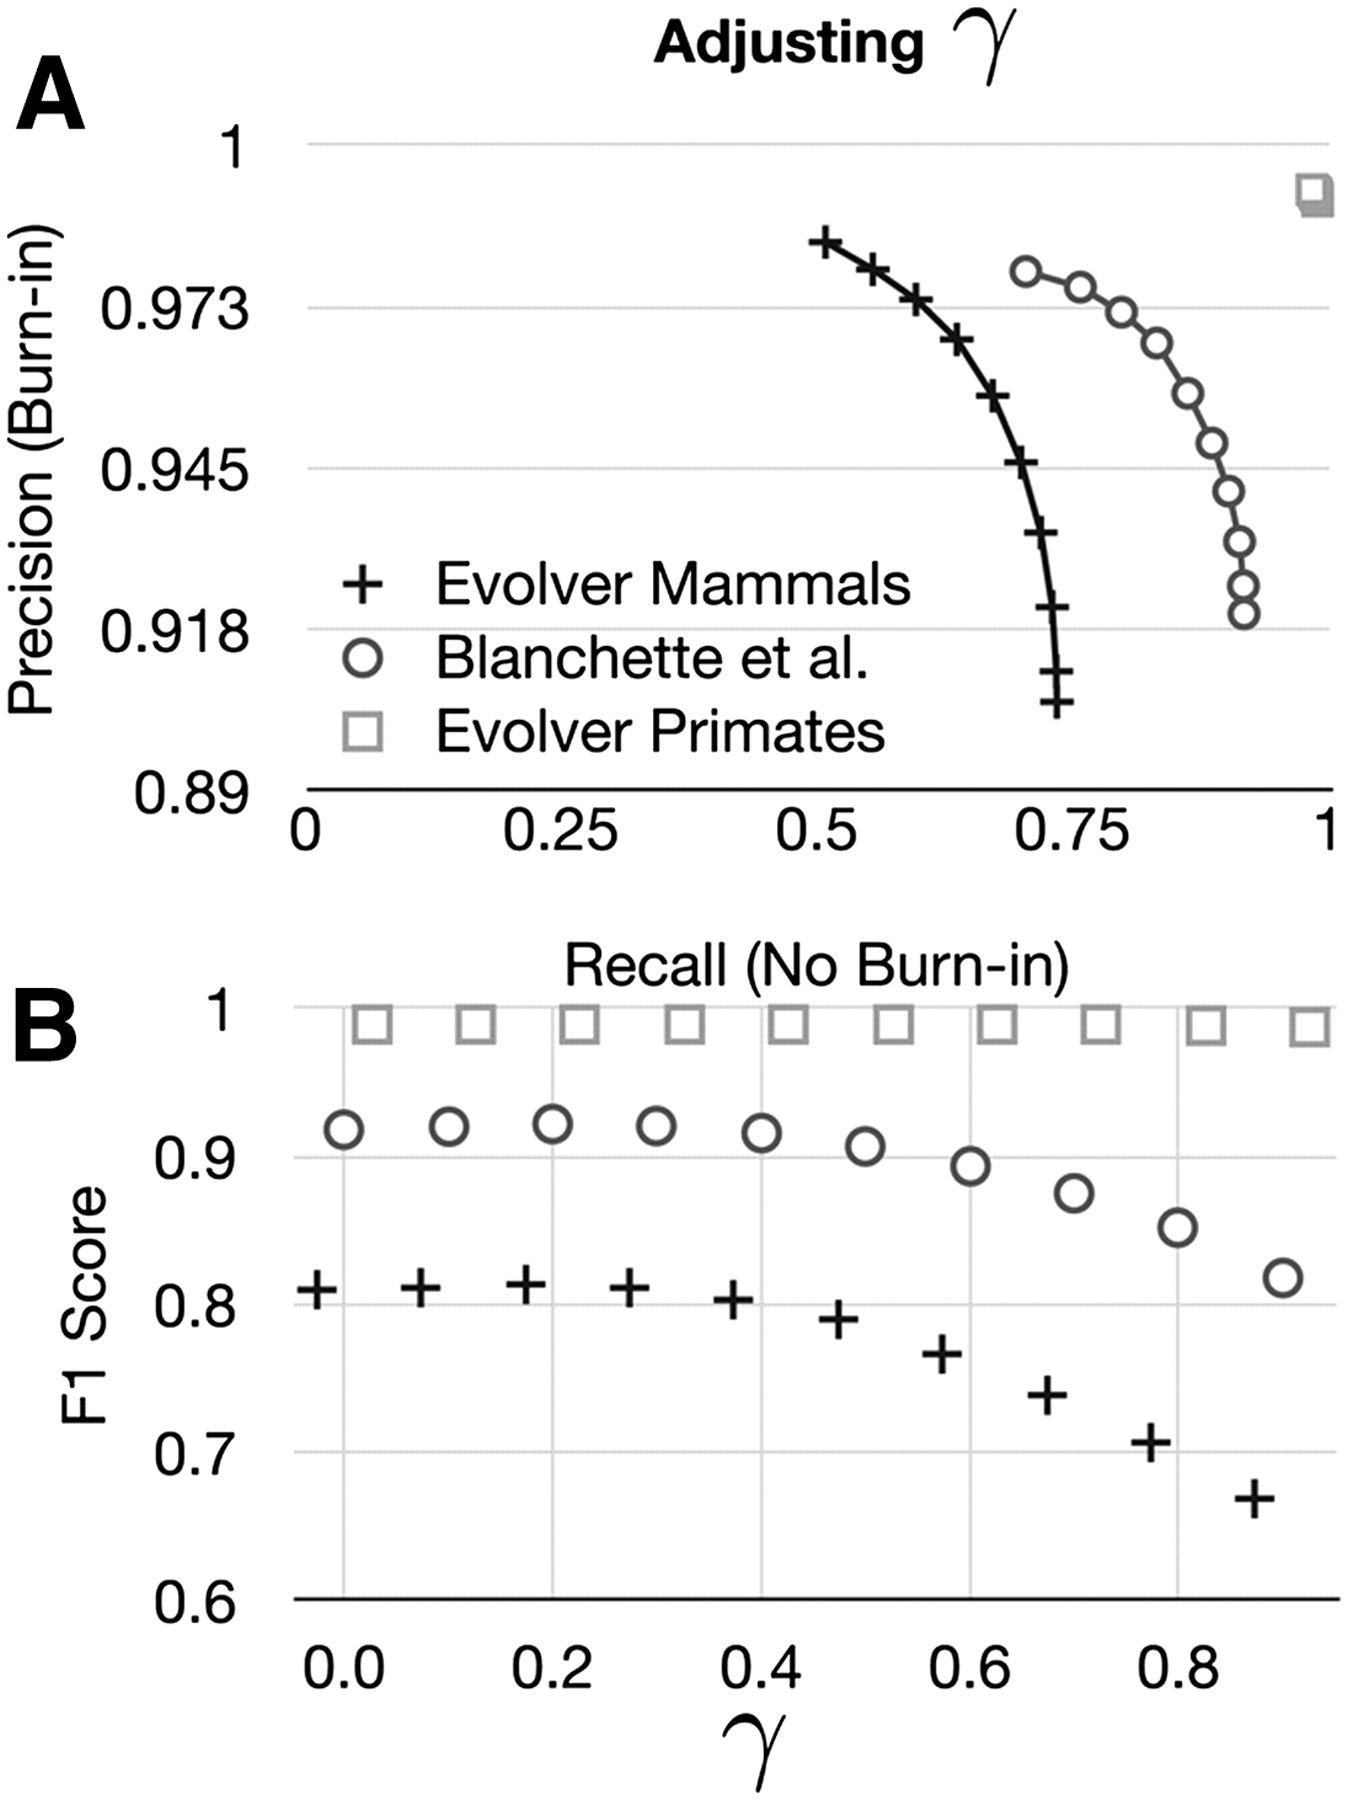
Figure 10.
The effect of adjusting γ. (A) A precision-recall plot of the predicted Cactus alignments showing the effect of altering γ, for the three different alignment simulations. (B) The F1 score as a function of γ for the three different simulations; shapes consistent with A.


