
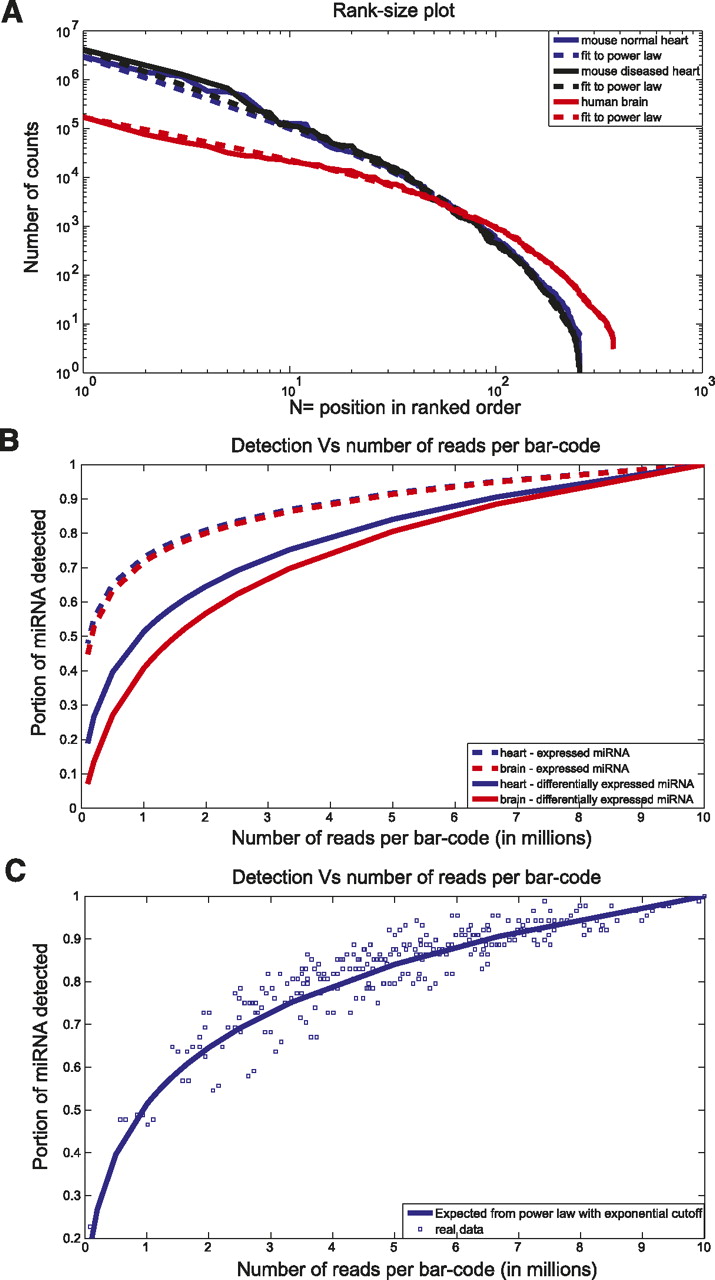
Modeling the detection efficiency as a function of the number of multiplexed samples. (A) Rank-size plot. Mouse normal heart, mouse diseased heart, and human brain data are plotted in blue, black, and red, respectively. The dashed lines are fits to power law with exponential cutoff. The fit has the form N^(−1.4) × exp(−N/47), N^(−1.4) × exp(−N/43), and N^(−0.8) × exp(−N/68) for mouse normal hearts, mouse diseased hearts, and human brain, respectively. (B) Expected portion of expressed miRNA (dashed lines) and differentially expressed miRNA (full lines) detected as a function of the number of reads per barcode. Human brain data are plotted in red and mouse normal heart data in blue. (C) Portion of differentially expressed miRNA detected as a function of the number of reads per barcode (see Methods). The blue boxes represent real data, and the blue line is the same as in B. Only reads uniquely aligned to miRNAs were used.


