
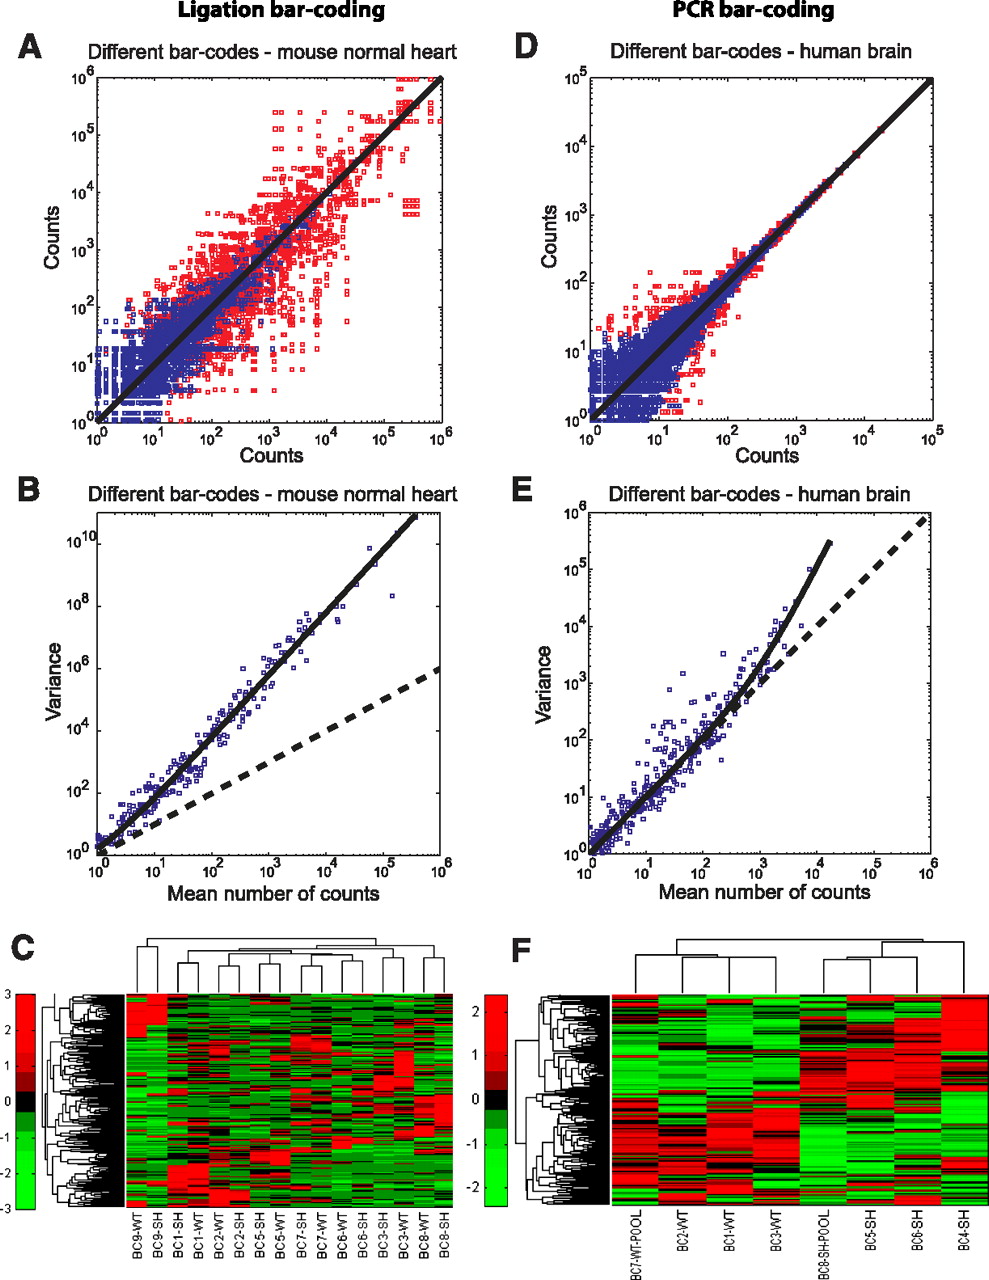
Barcoding bias analysis. (A,D) Total number of miRNA counts in each barcode compared with all the other barcodes (all the possible comparisons are plotted). The blue boxes represent points within the 99% region of Poisson noise, and the red boxes represent points outside this region. (A) When using ligation barcoding and normal mouse heart data, only 73% of all points fall inside this region, attesting for a barcode bias. (D) When using PCR barcoding and human brain data, 97% of all points fall inside the Poisson noise region. (B,E) The variance in counts number for a specific miRNA among the different barcodes as a function of the mean, plotted for all miRNAs. The black dotted line is the expected Poisson distribution with no barcode bias. The black full line is a fit to the general form expected for biased barcodes (see Methods). (B) When using ligation barcoding and normal mouse heart data, the variance due to barcodes diversity is much larger than the Poisson noise. (E) When using PCR barcoding and human brain data, only Poisson noise is evident for most of the experimentally relevant regime. (C,F) Hierarchical clustering of the miRNA expression profiles across different barcodes and biological conditions. (C) When using ligation-based barcodes, miRNA expression profiles cluster according to their barcodes, although they were derived from two different experimental conditions (normal and diseased mouse hearts, marked with WT and SH, respectively). (F) When using PCR-based barcodes, miRNA expression profiles cluster according to the experimental condition.


