
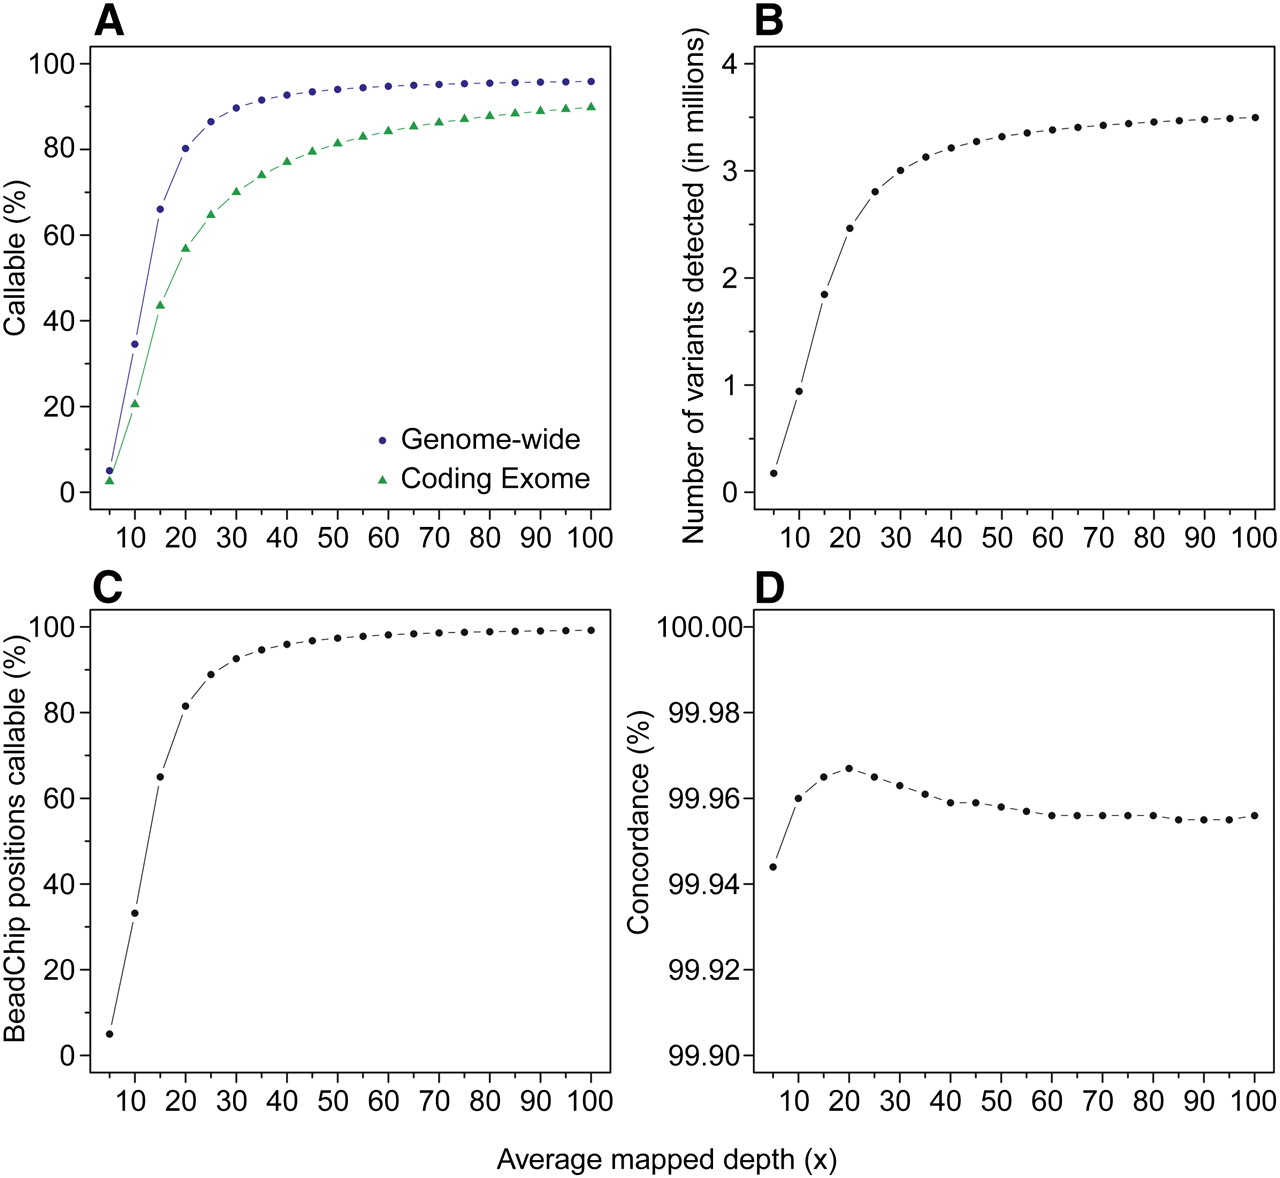
Figure 5.
Genotype calling as a function of average mapped depth. The x-axes represent the average mapped depth of each data set, and the y-axes represent the proportion of the whole genome (dark blue circles) and coding exome (green triangles) that is callable (A), the number of SNVs detected (B), the proportion of Illumina BeadChip positions callable (C), and the concordance rates with the BeadChip calls (D).


