
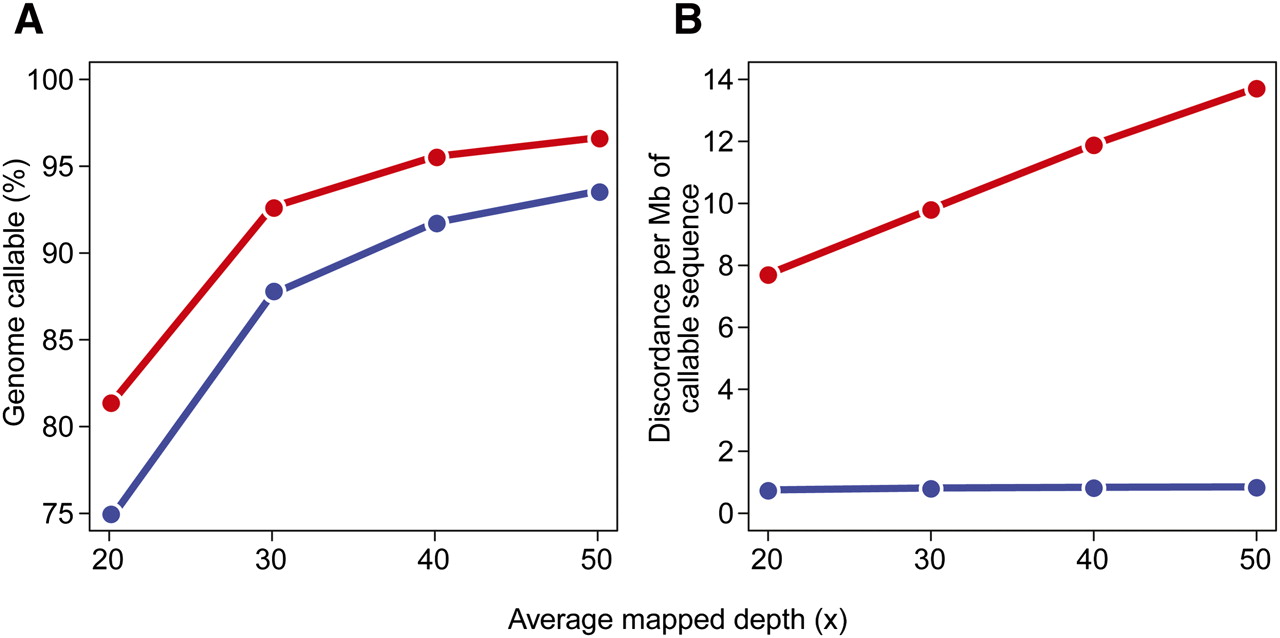
Figure 4.
Comparison of identical genomes at various mapped depths. (A,B) The x-axes represent the average mapped depths at which two identical genomes were compared. The y-axes represent the proportion of hg18 callable in both genomes (A) and the discordance per megabase of callable sequence (B). Analyses were done on all unique alignments (MapQ > 0) without applying any filters (red curve) and after applying mapping quality and genotype confidence filters as explained in the text (blue curve).


