
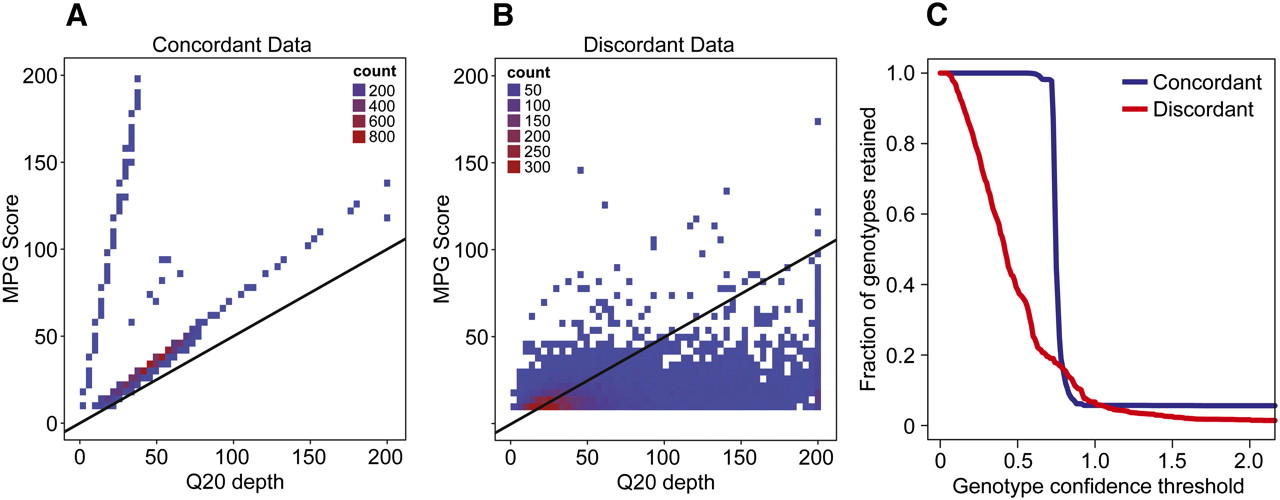
Figure 3.
Determination of genotype confidence threshold for genotype calls. (A,B) The x-axes represent Q20 depth for genotype calls from one of the 50× genomes, and the y-axes represent corresponding MPG scores. (A) A random set of ∼8700 concordant genotypes; (B) 8710 discordant genotypes. Black lines represent a line with slope of 0.5, which is the confidence threshold used to filter genotypes. (C) The fraction of genotypes retained by varying the confidence threshold; (blue curve) the fraction of concordant genotypes retained; (red curve) the fraction of discordant genotypes retained.


