
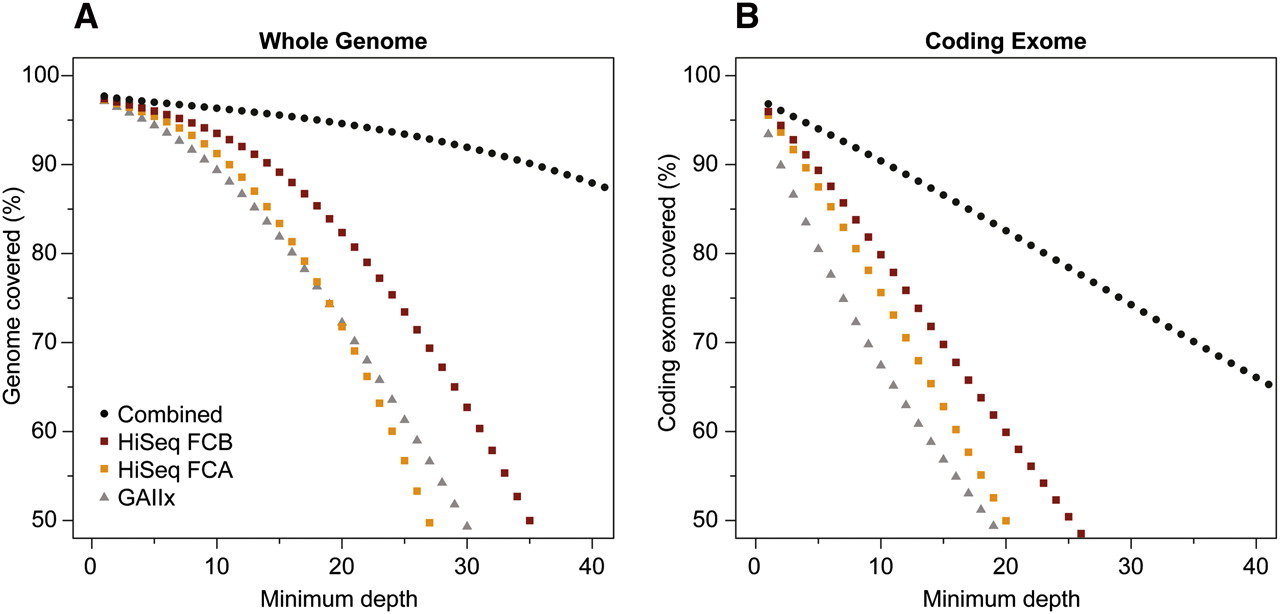
Figure 1.
Breadth versus depth of whole-genome coverage. The x-axis represents the minimum number of high-quality bases (≥Q20) from high-quality alignments (≥MapQ30), and the y-axis represents the proportion of genome (A) or coding exome (B) covered at that depth. To calculate percentages, the total size of hg18 build and the total number of non-redundant coding bases from the UCSC Known Genes table (2,852,680,119 bp and 34,068,542 bp, respectively) were used. Gaps and pseudo-autosomal regions (PAR) were excluded. Values were plotted for GAIIx (triangle), HiSeq flowcell A (orange square), HiSeq 2000 flowcell B (dark red square), and all data sets combined (circle).


