
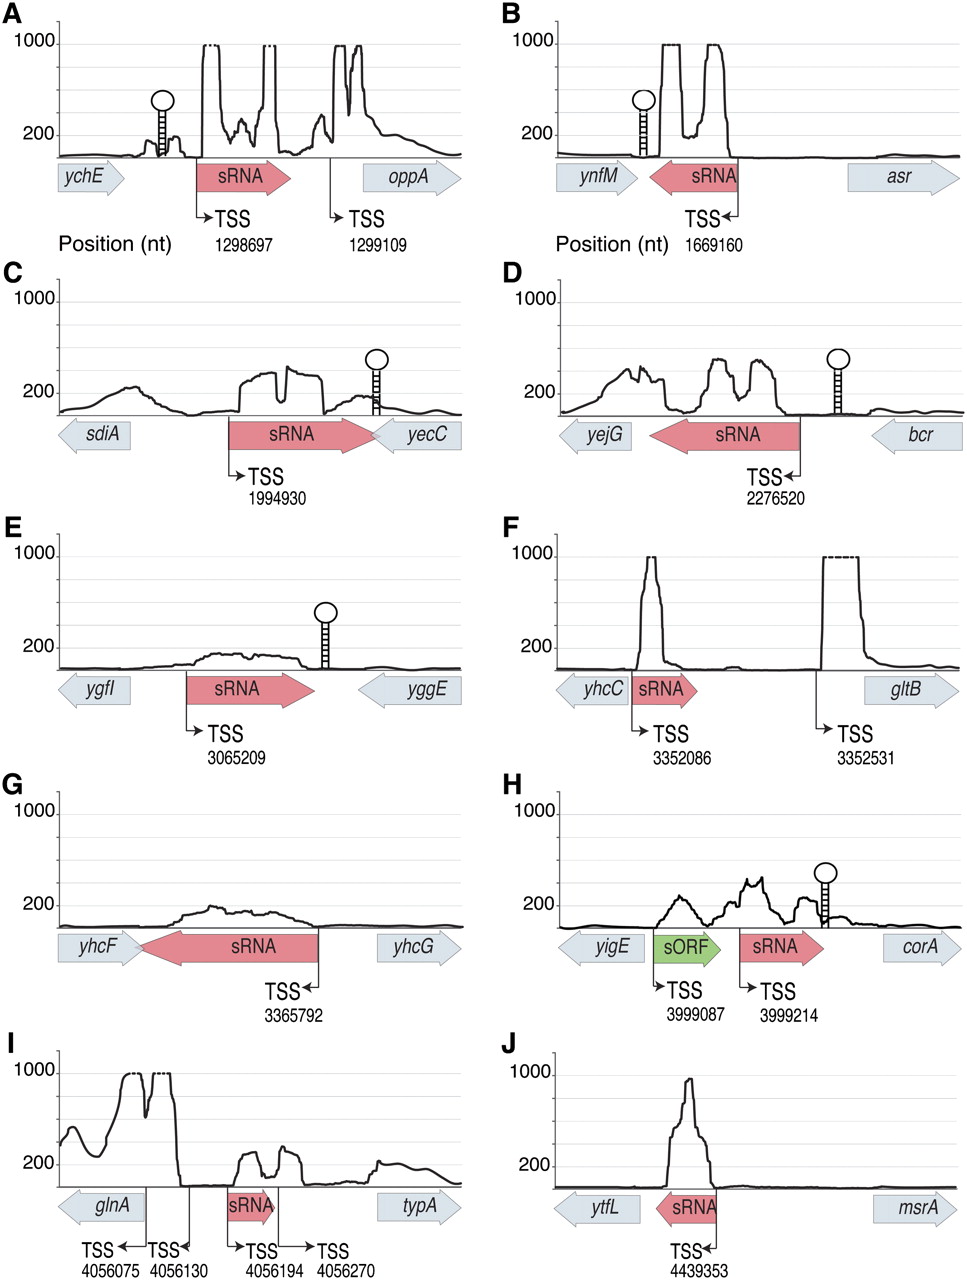
Figure 3.
Detection of novel sRNAs in intergenic regions. (A–J) Expression profiles of intergenic regions. The y-axes denote coverage at each nucleotide, limited to a maximum of 1000 (dashed lines). Positions of transcription start sites (TSS) and terminators (stem–loop structures) found within each intergenic region are depicted. Nucleotide positions follow the numbering of the E. coli genome (NC_000913.2). Wide arrows on x-axes contain named ORFs (gray), sRNAs (pink), and an unnamed small ORF (green). Lengths of flanking genes are not drawn to scale.


