
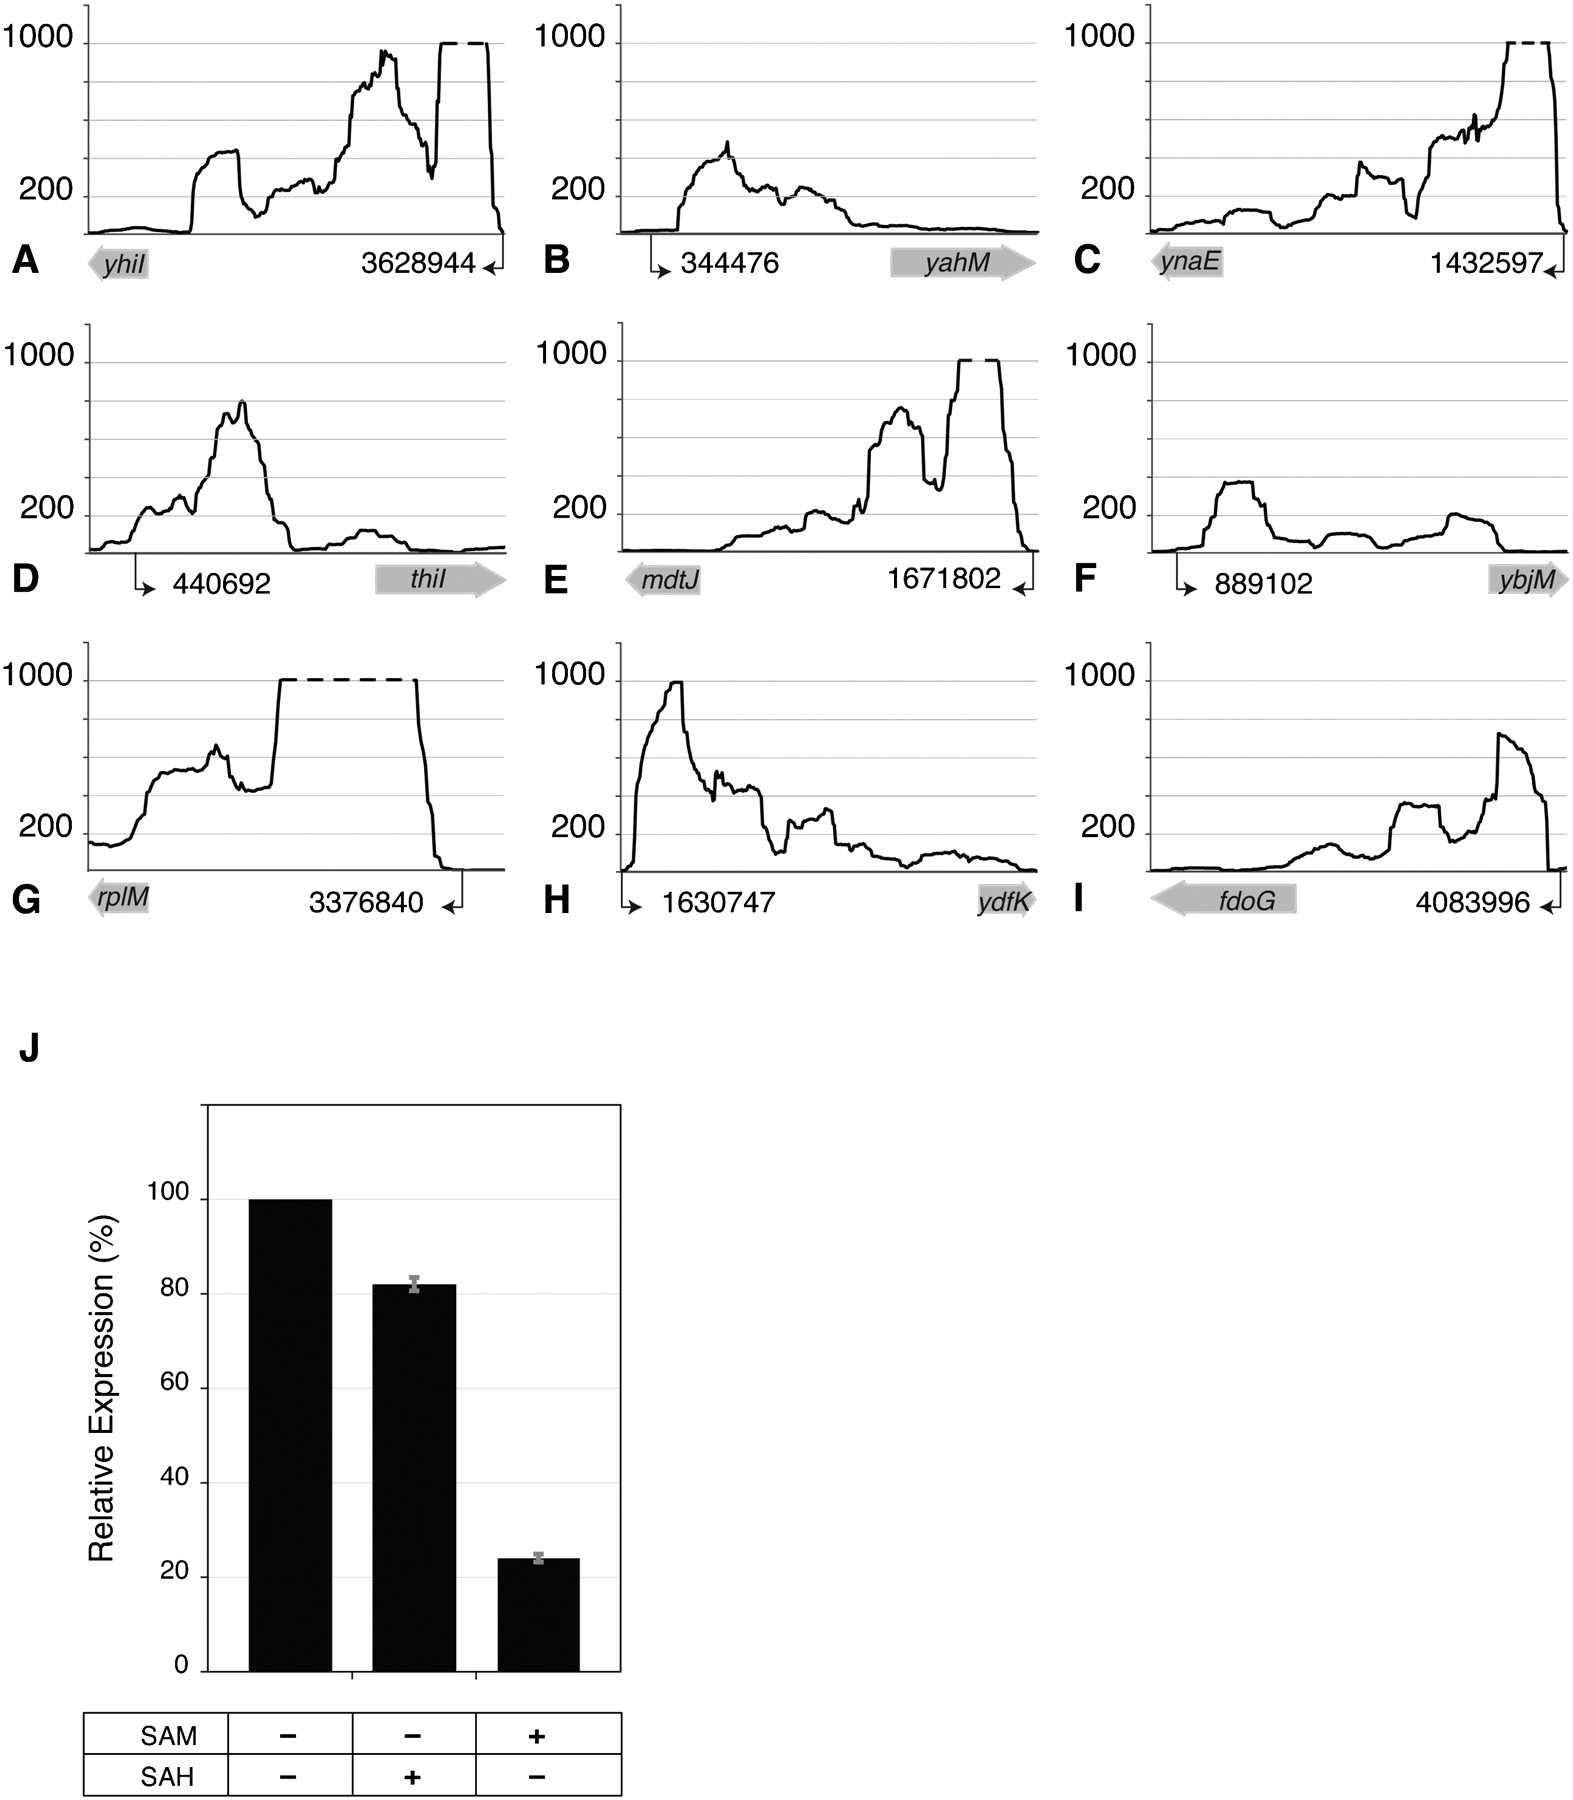
Transcription termination at putative regulatory leader sequences. (A–I) Expression profiles of leader sequences and downstream coding regions. The y-axes denote coverage at each nucleotide position, limited to a maximum coverage of 1000 (dashed lines). Putative transcription start sites (black arrows) and their locations in the E. coli genome (NC_000913.2) are shown on x-axes. Lengths of the corresponding ORFs (wide gray arrows) are not drawn to scale. (J) In vitro transcription of thiI coding region by T7 RNA polymerase in the presence of 100 μM S-adenosylmethionine (SAM) or S-adenosylhomocysteine (SAH) relative to its expression in the absence of SAM and SAH. Data represent means of three experiments ± standard deviations.


