
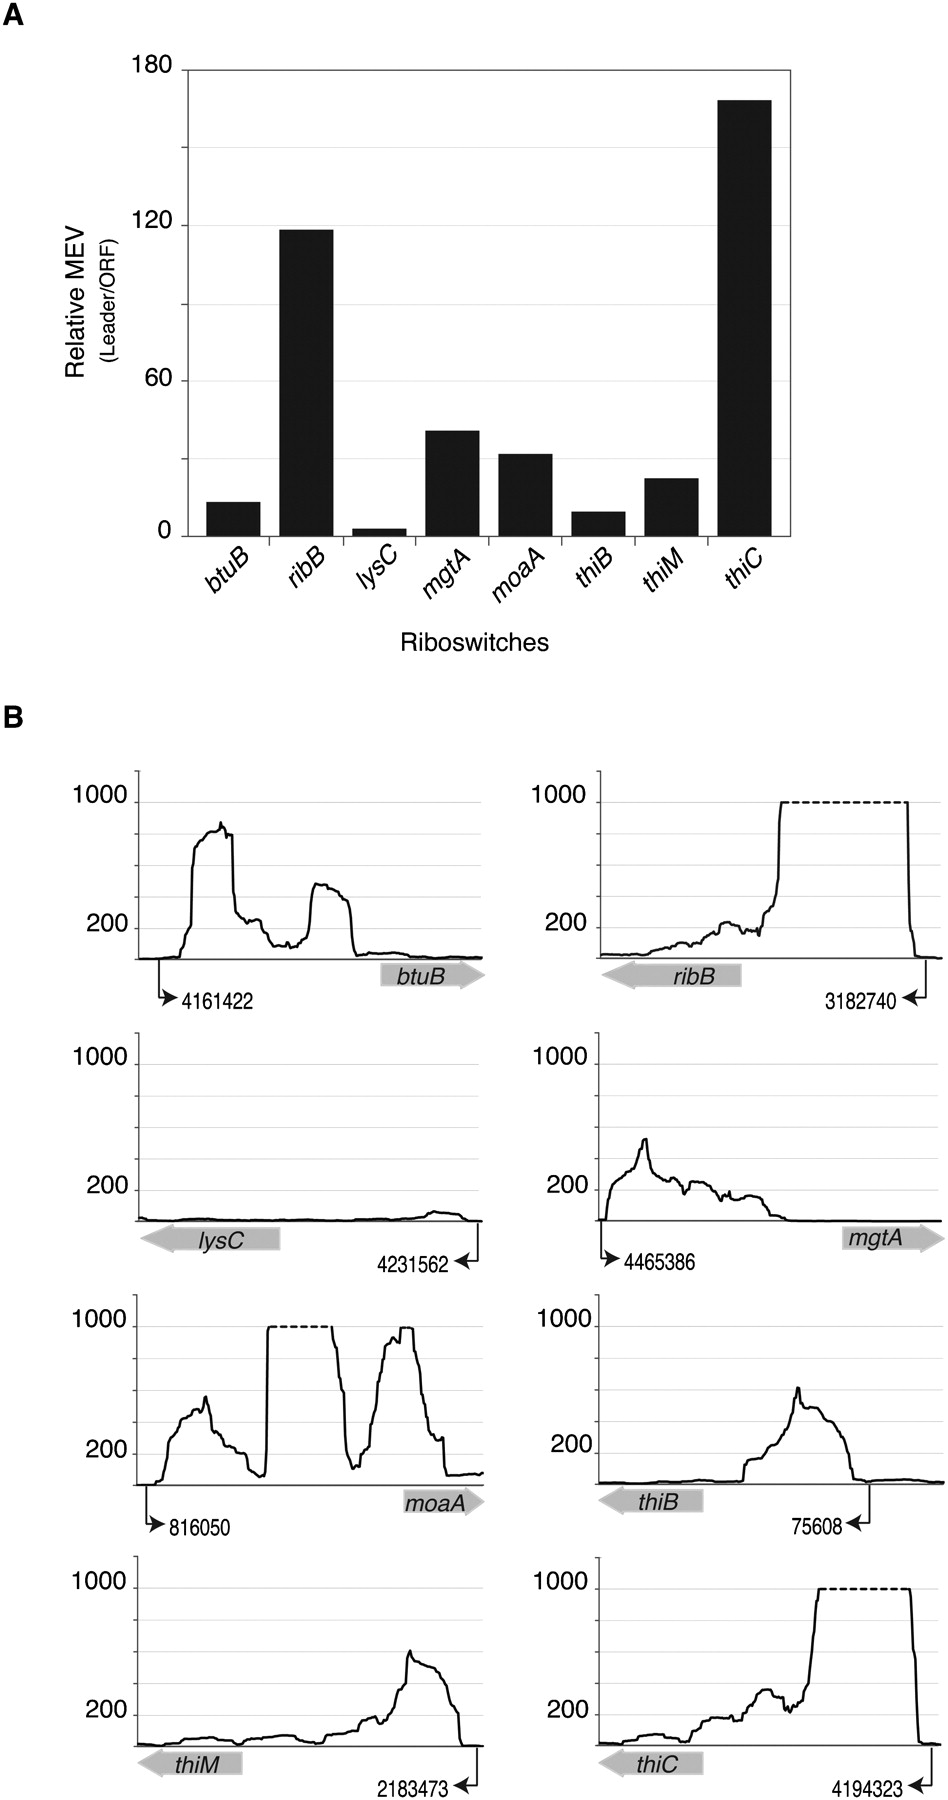
Figure 1.
Transcription termination at known riboswitches. (A) Ratios of mean expression values (MEV) of upstream leader regions to those of their corresponding ORFs. Positive values show that the MEVs of riboswitches are markedly higher than the MEVs of their downstream coding regions. (B) Expression profiles of leader sequences and downstream coding regions. The y-axes denote coverage at each nucleotide position, limited to a maximum coverage of 1000 (dashed lines). Numerical positions of transcription start sites (black arrows) follow the coordinates for the E. coli K12 genome (NC_000913.2). Wide gray arrows on x-axes, depicting ORFs, are not drawn to scale.


